
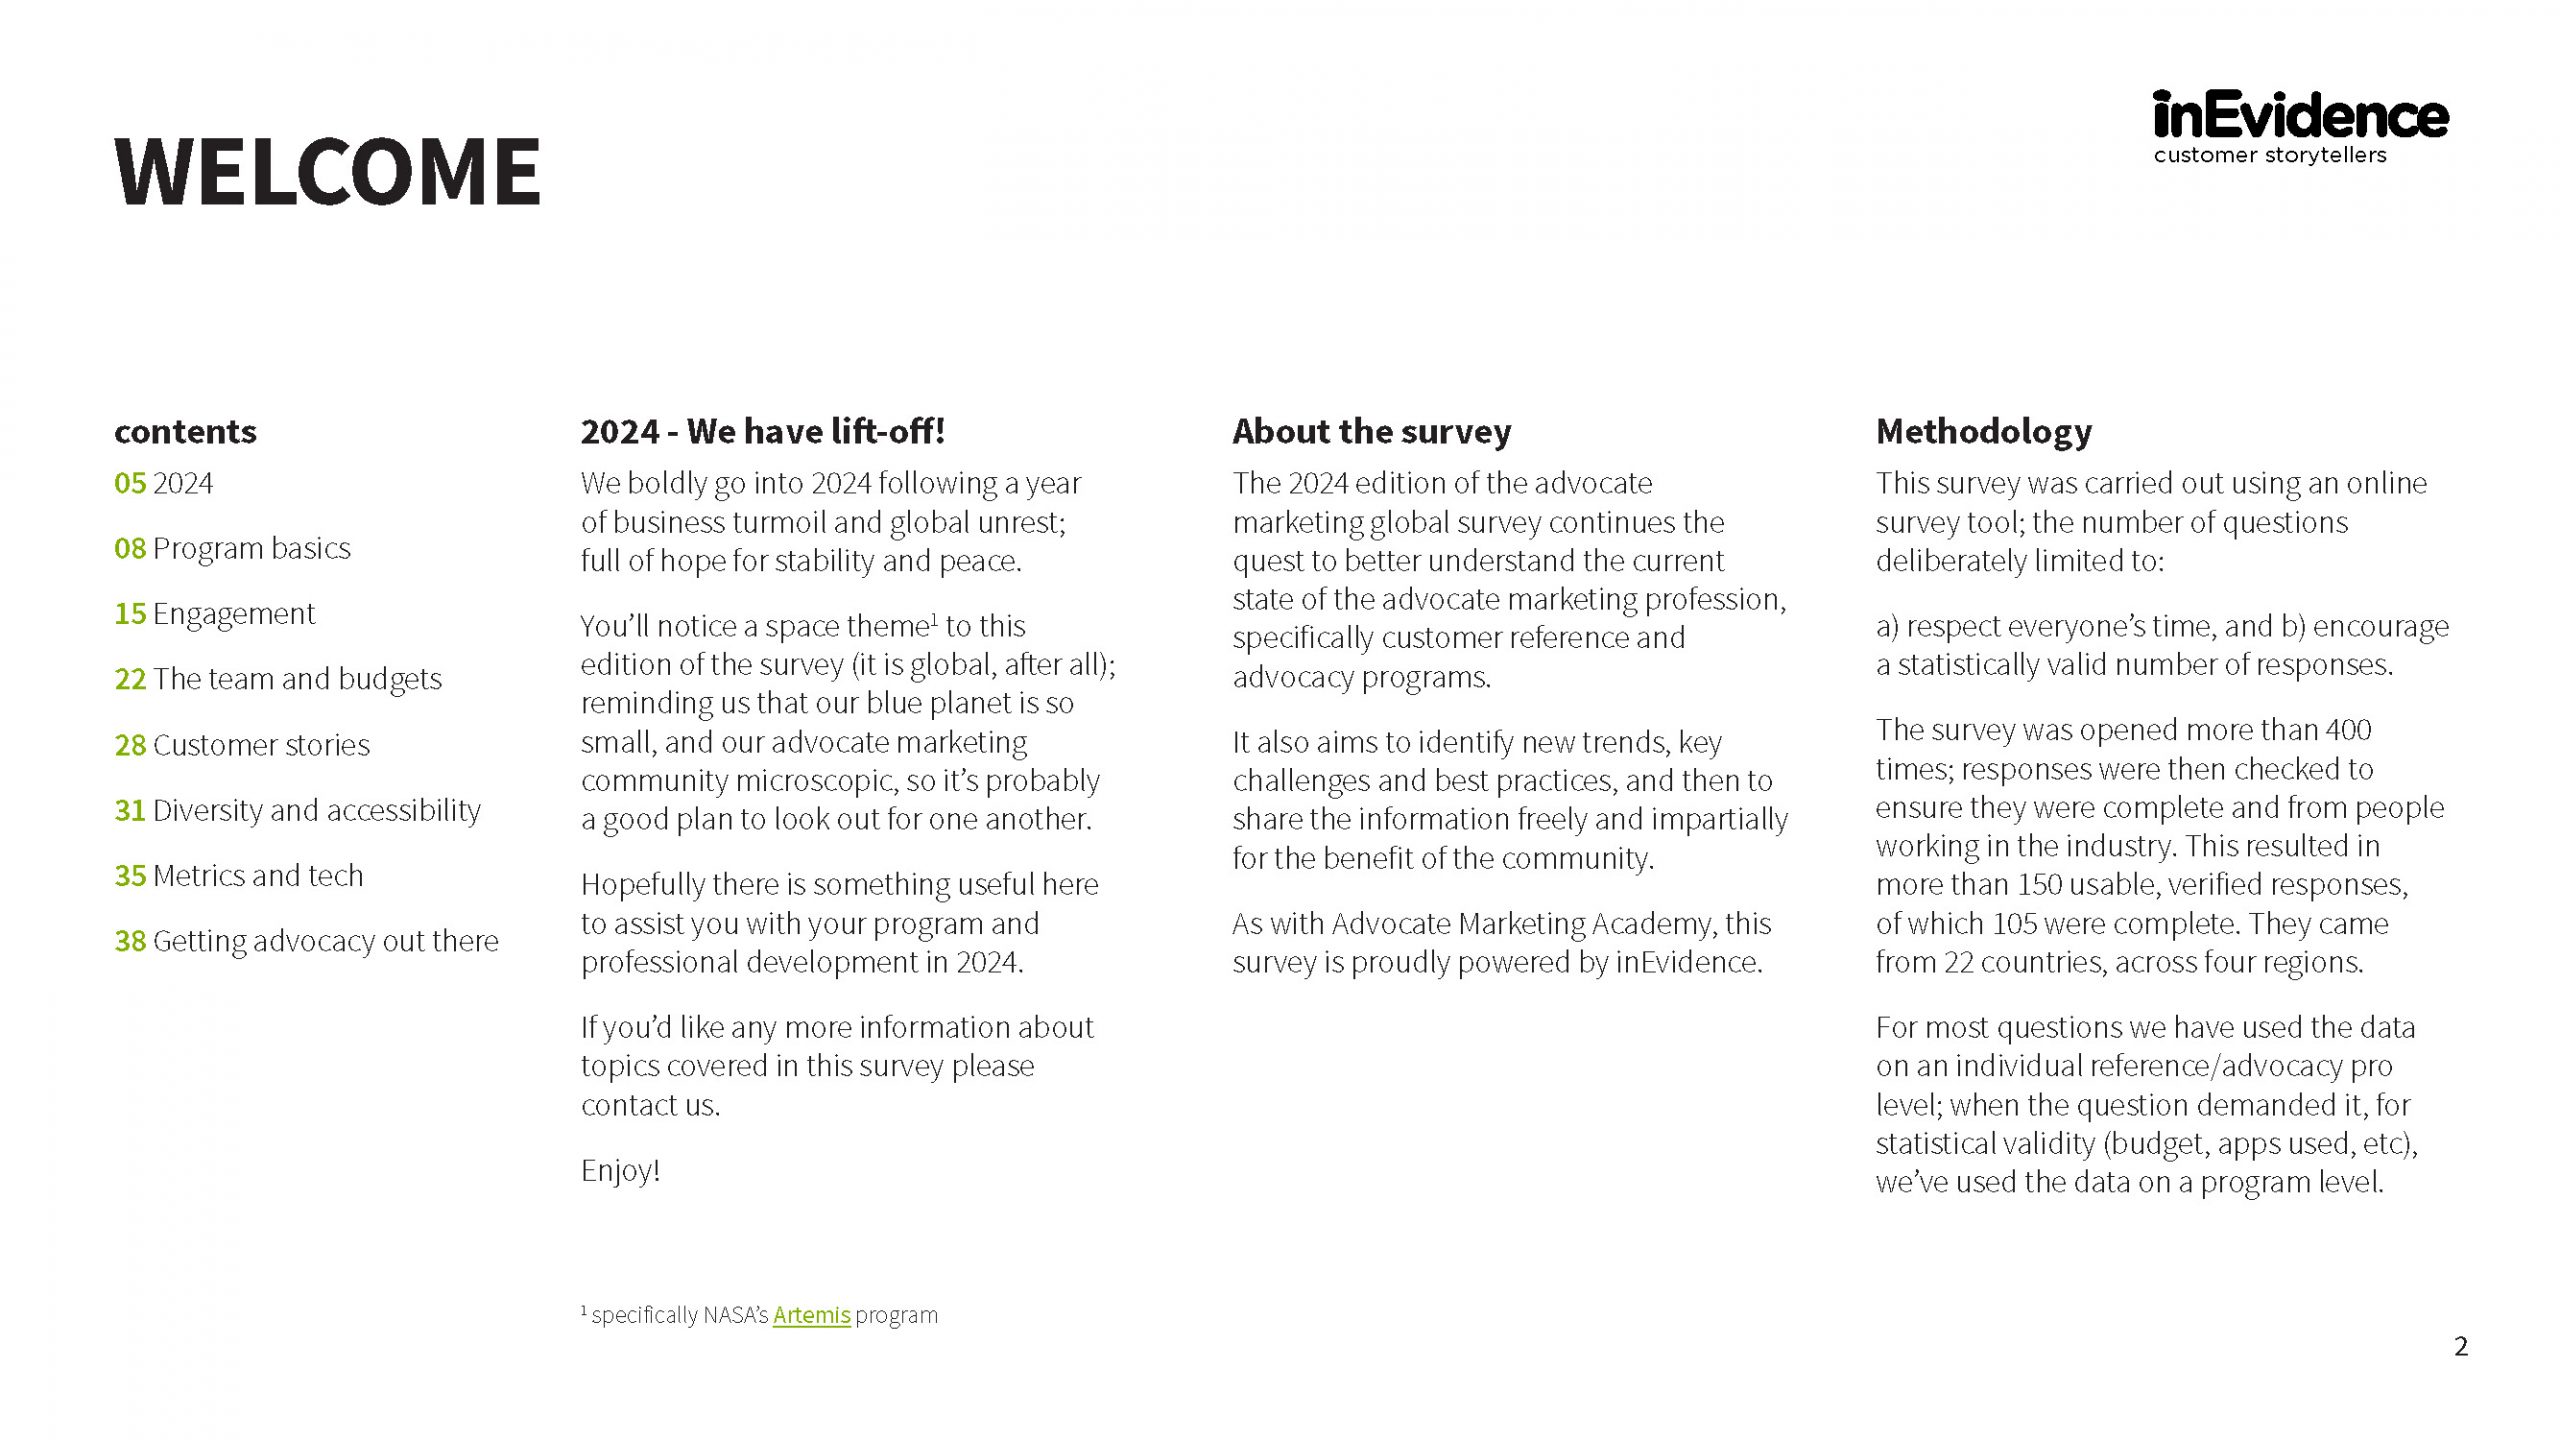


Slides will pause if you hover over one. Download your copy of the full survey HERE
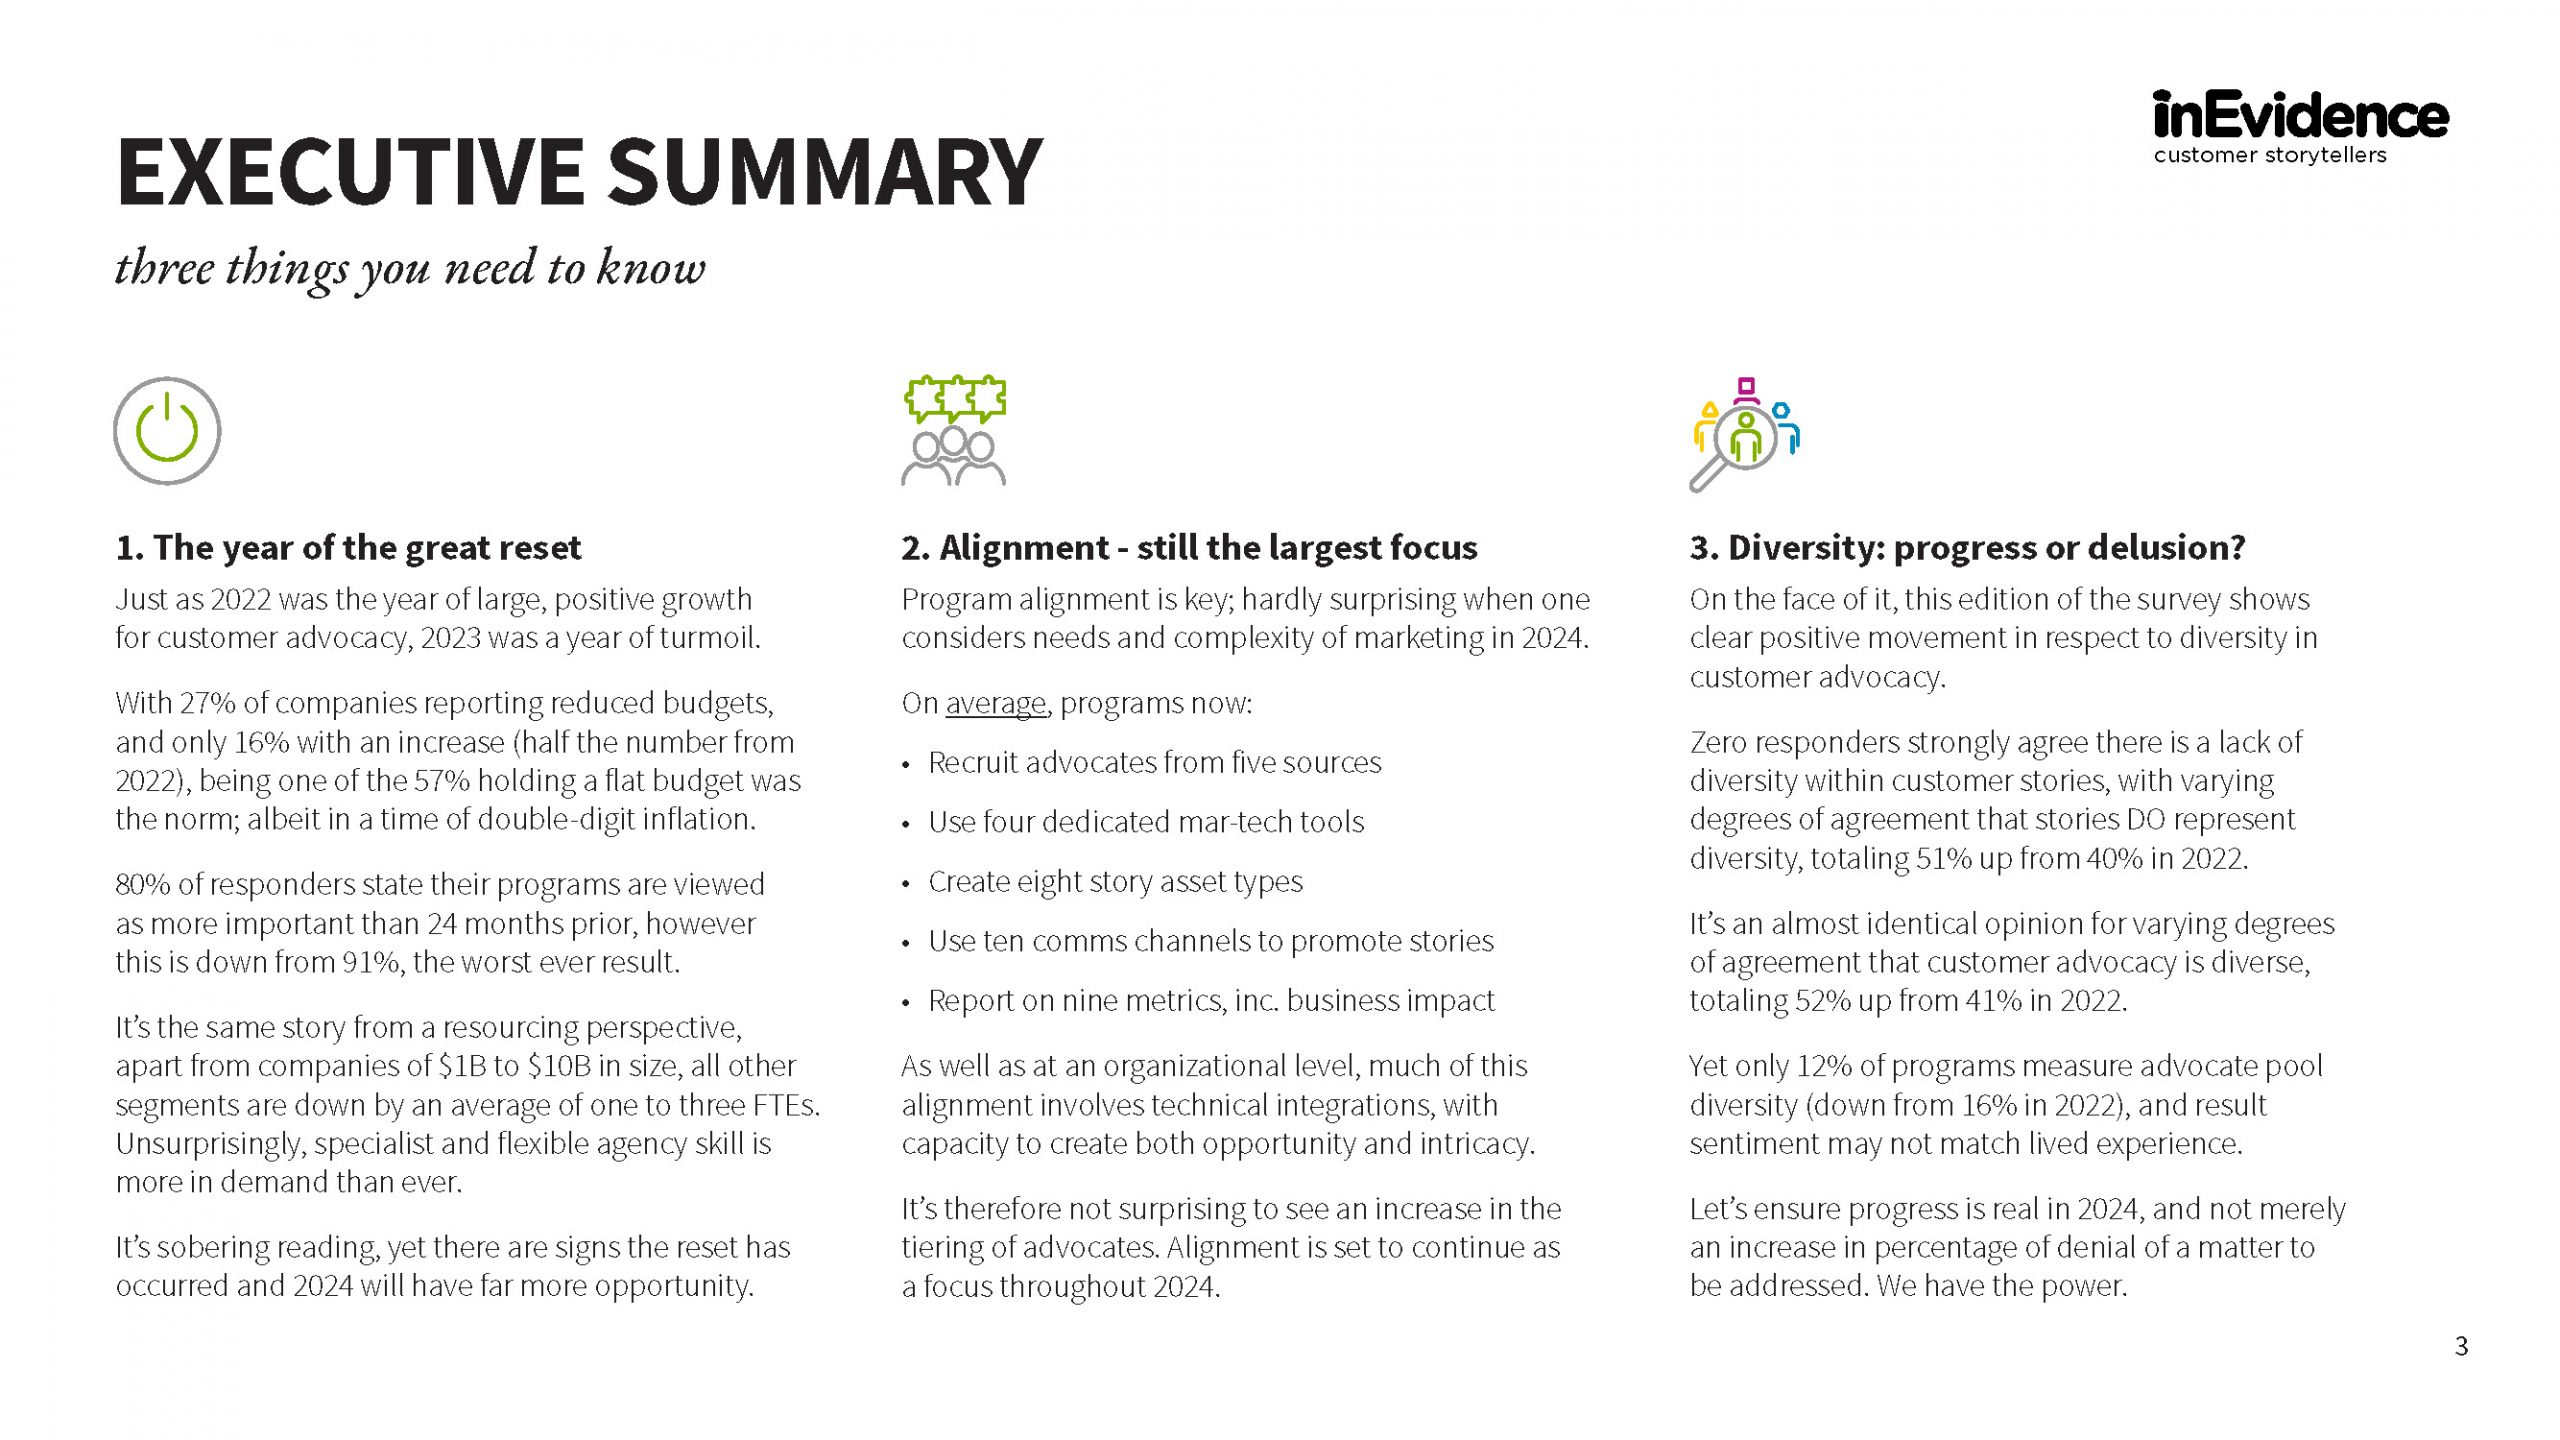
1. The year of the great reset
Just as 2022 was the year of large, positive growth for customer advocacy, 2023 was a year of turmoil.
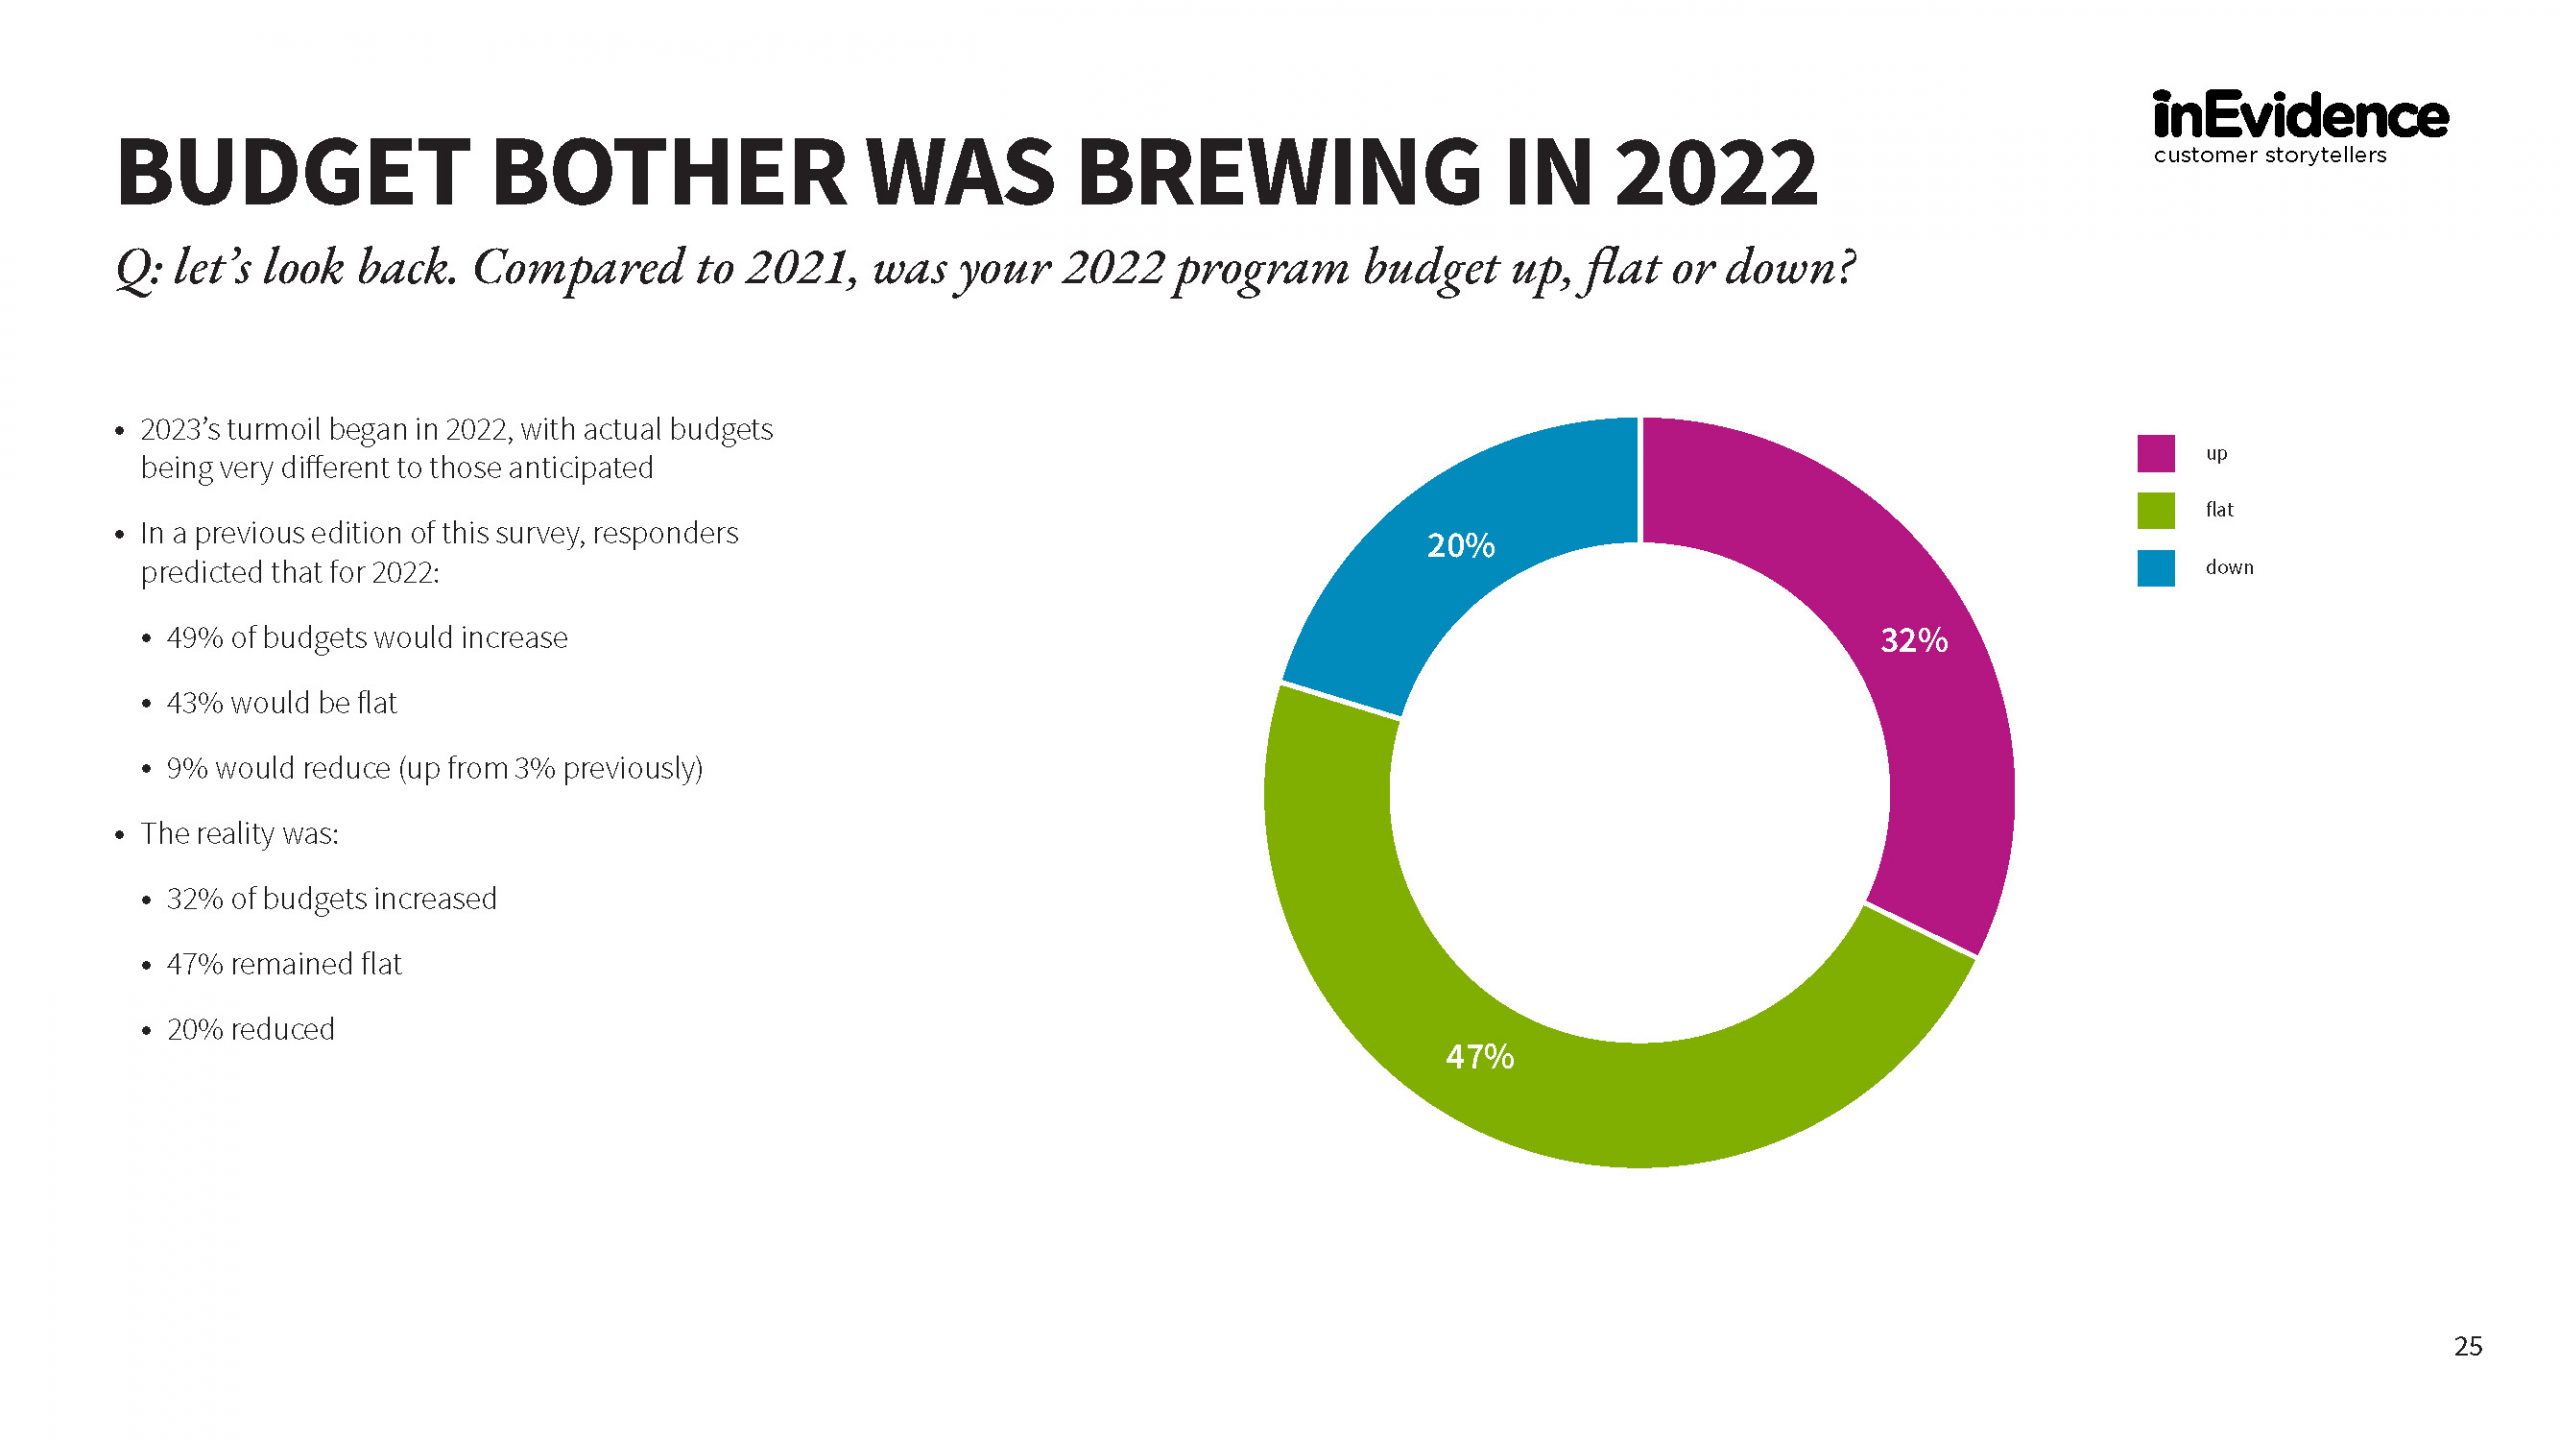
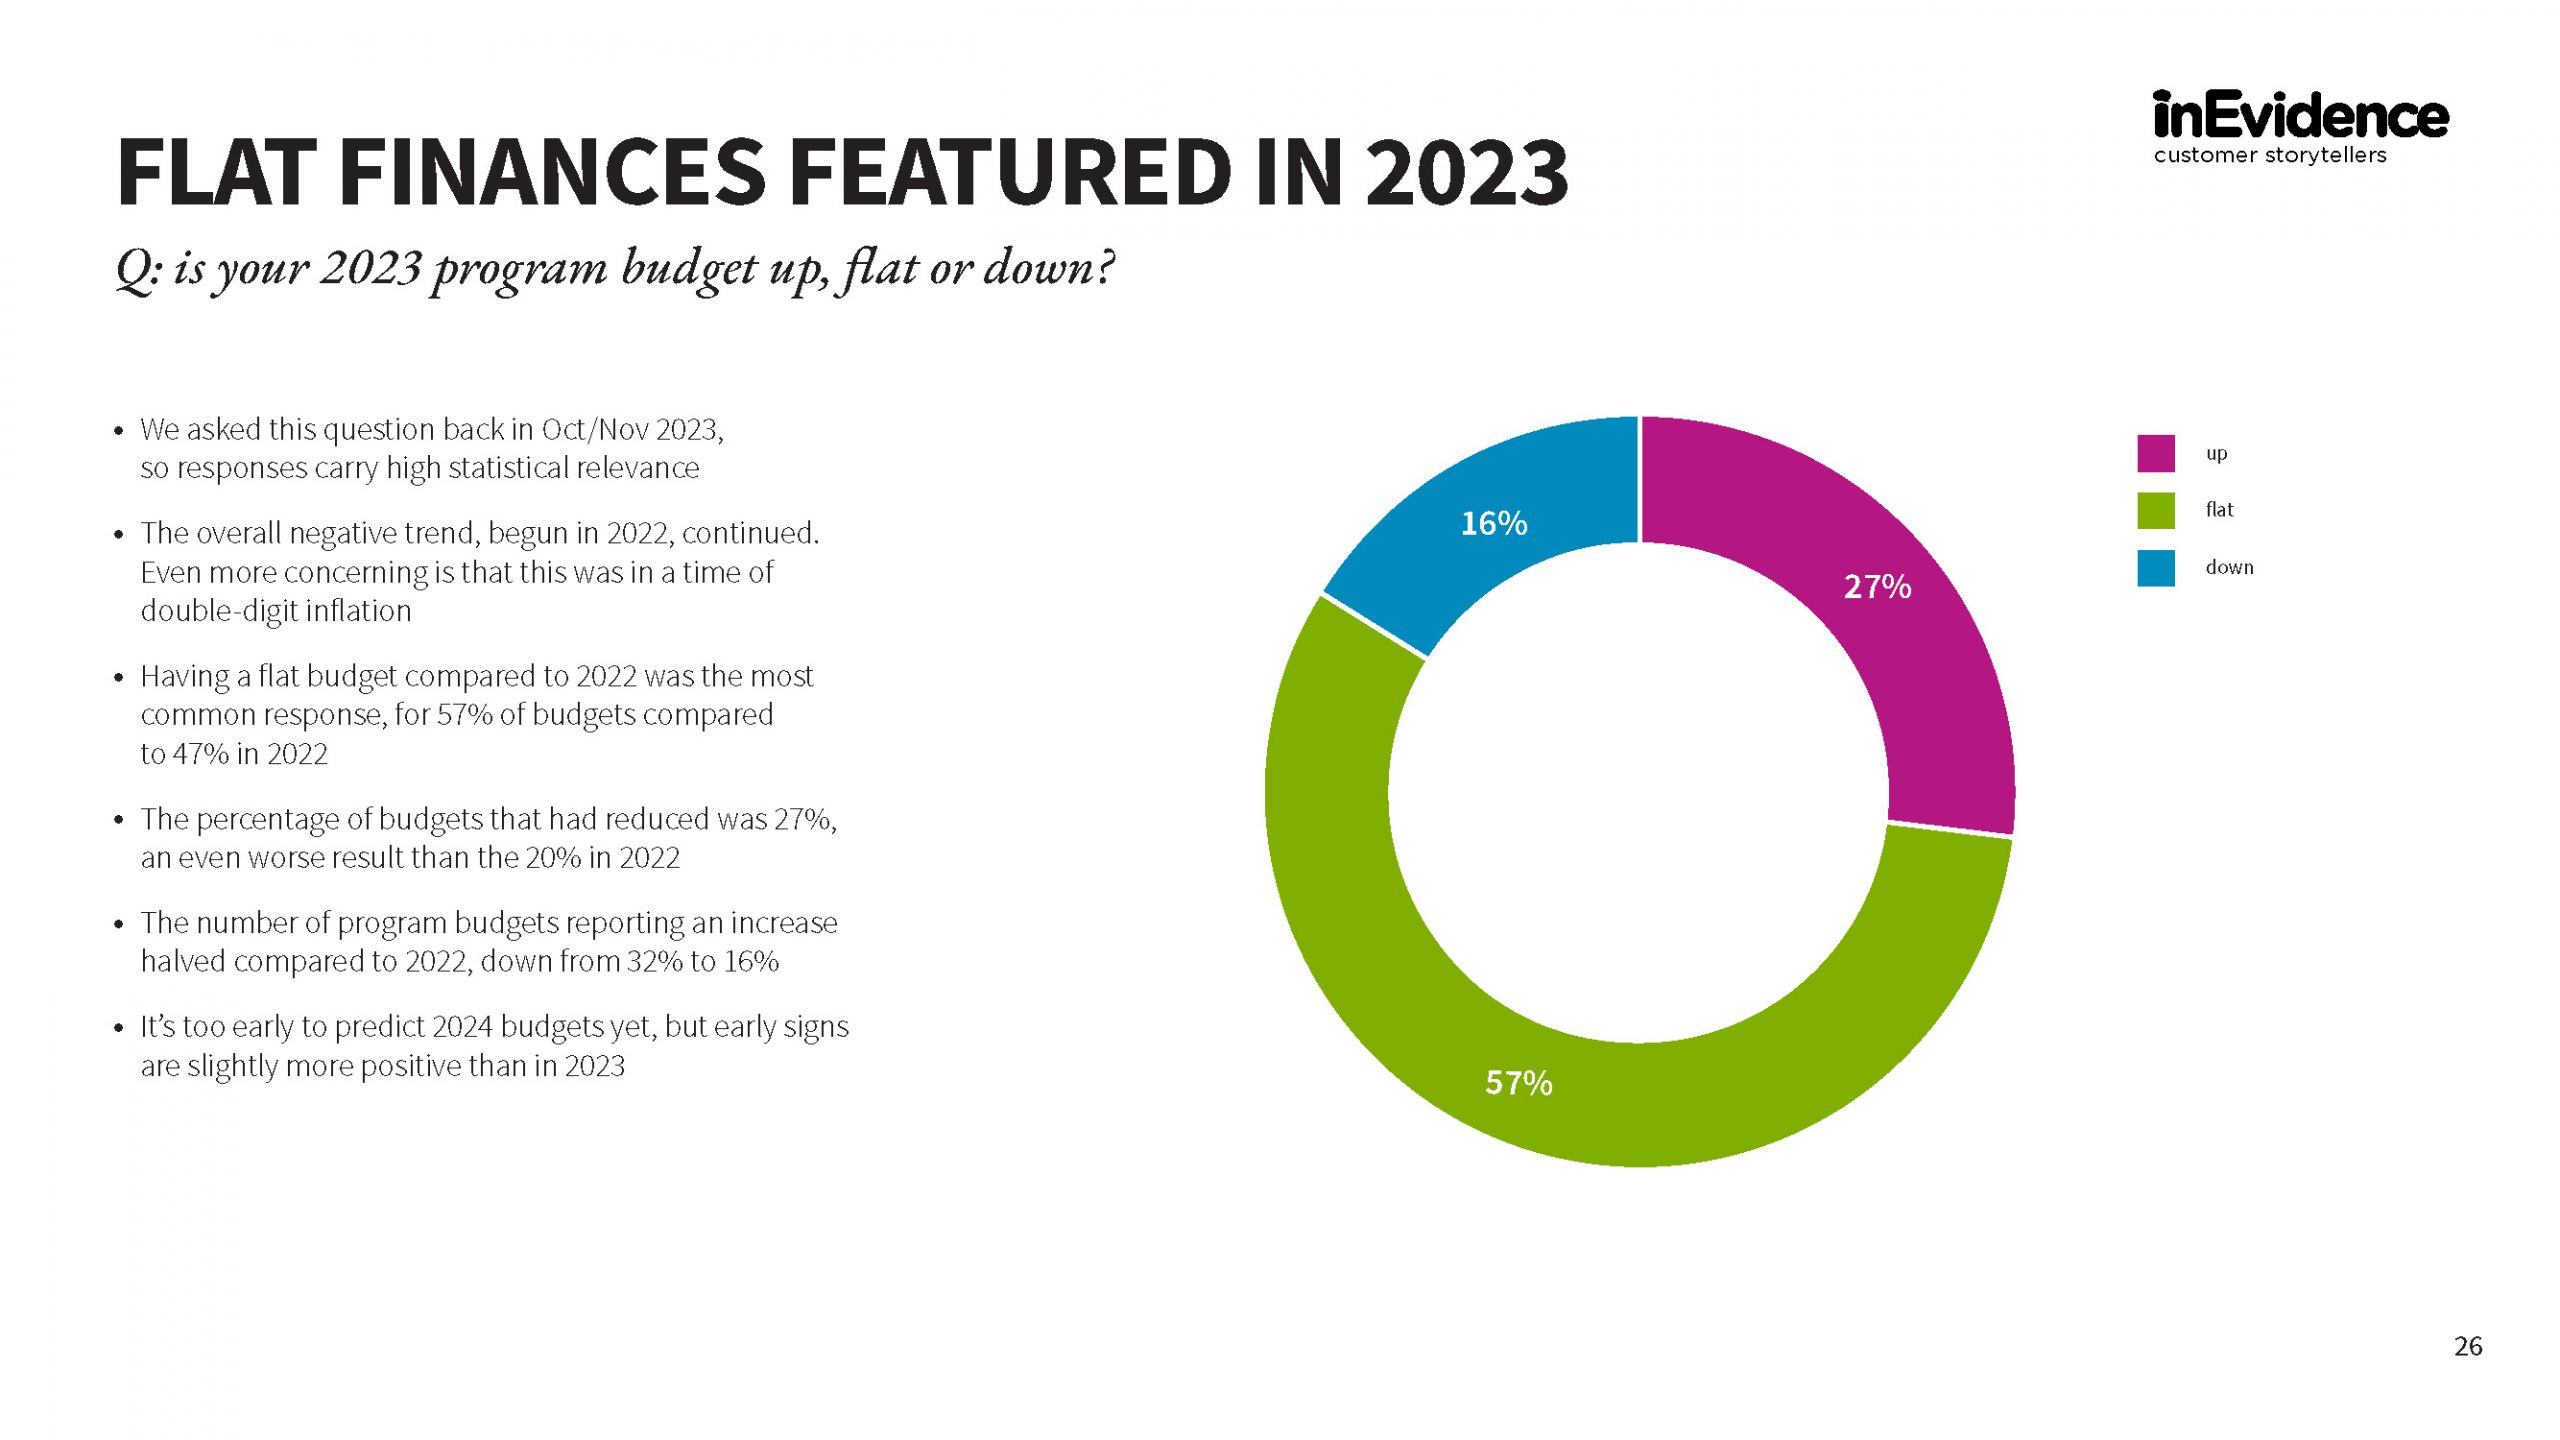
With 27% of companies reporting reduced budgets, and only 16% with an increase (half the number from 2022), being one of the 57% holding a flat budget was the norm; albeit in a time of double-digit inflation.
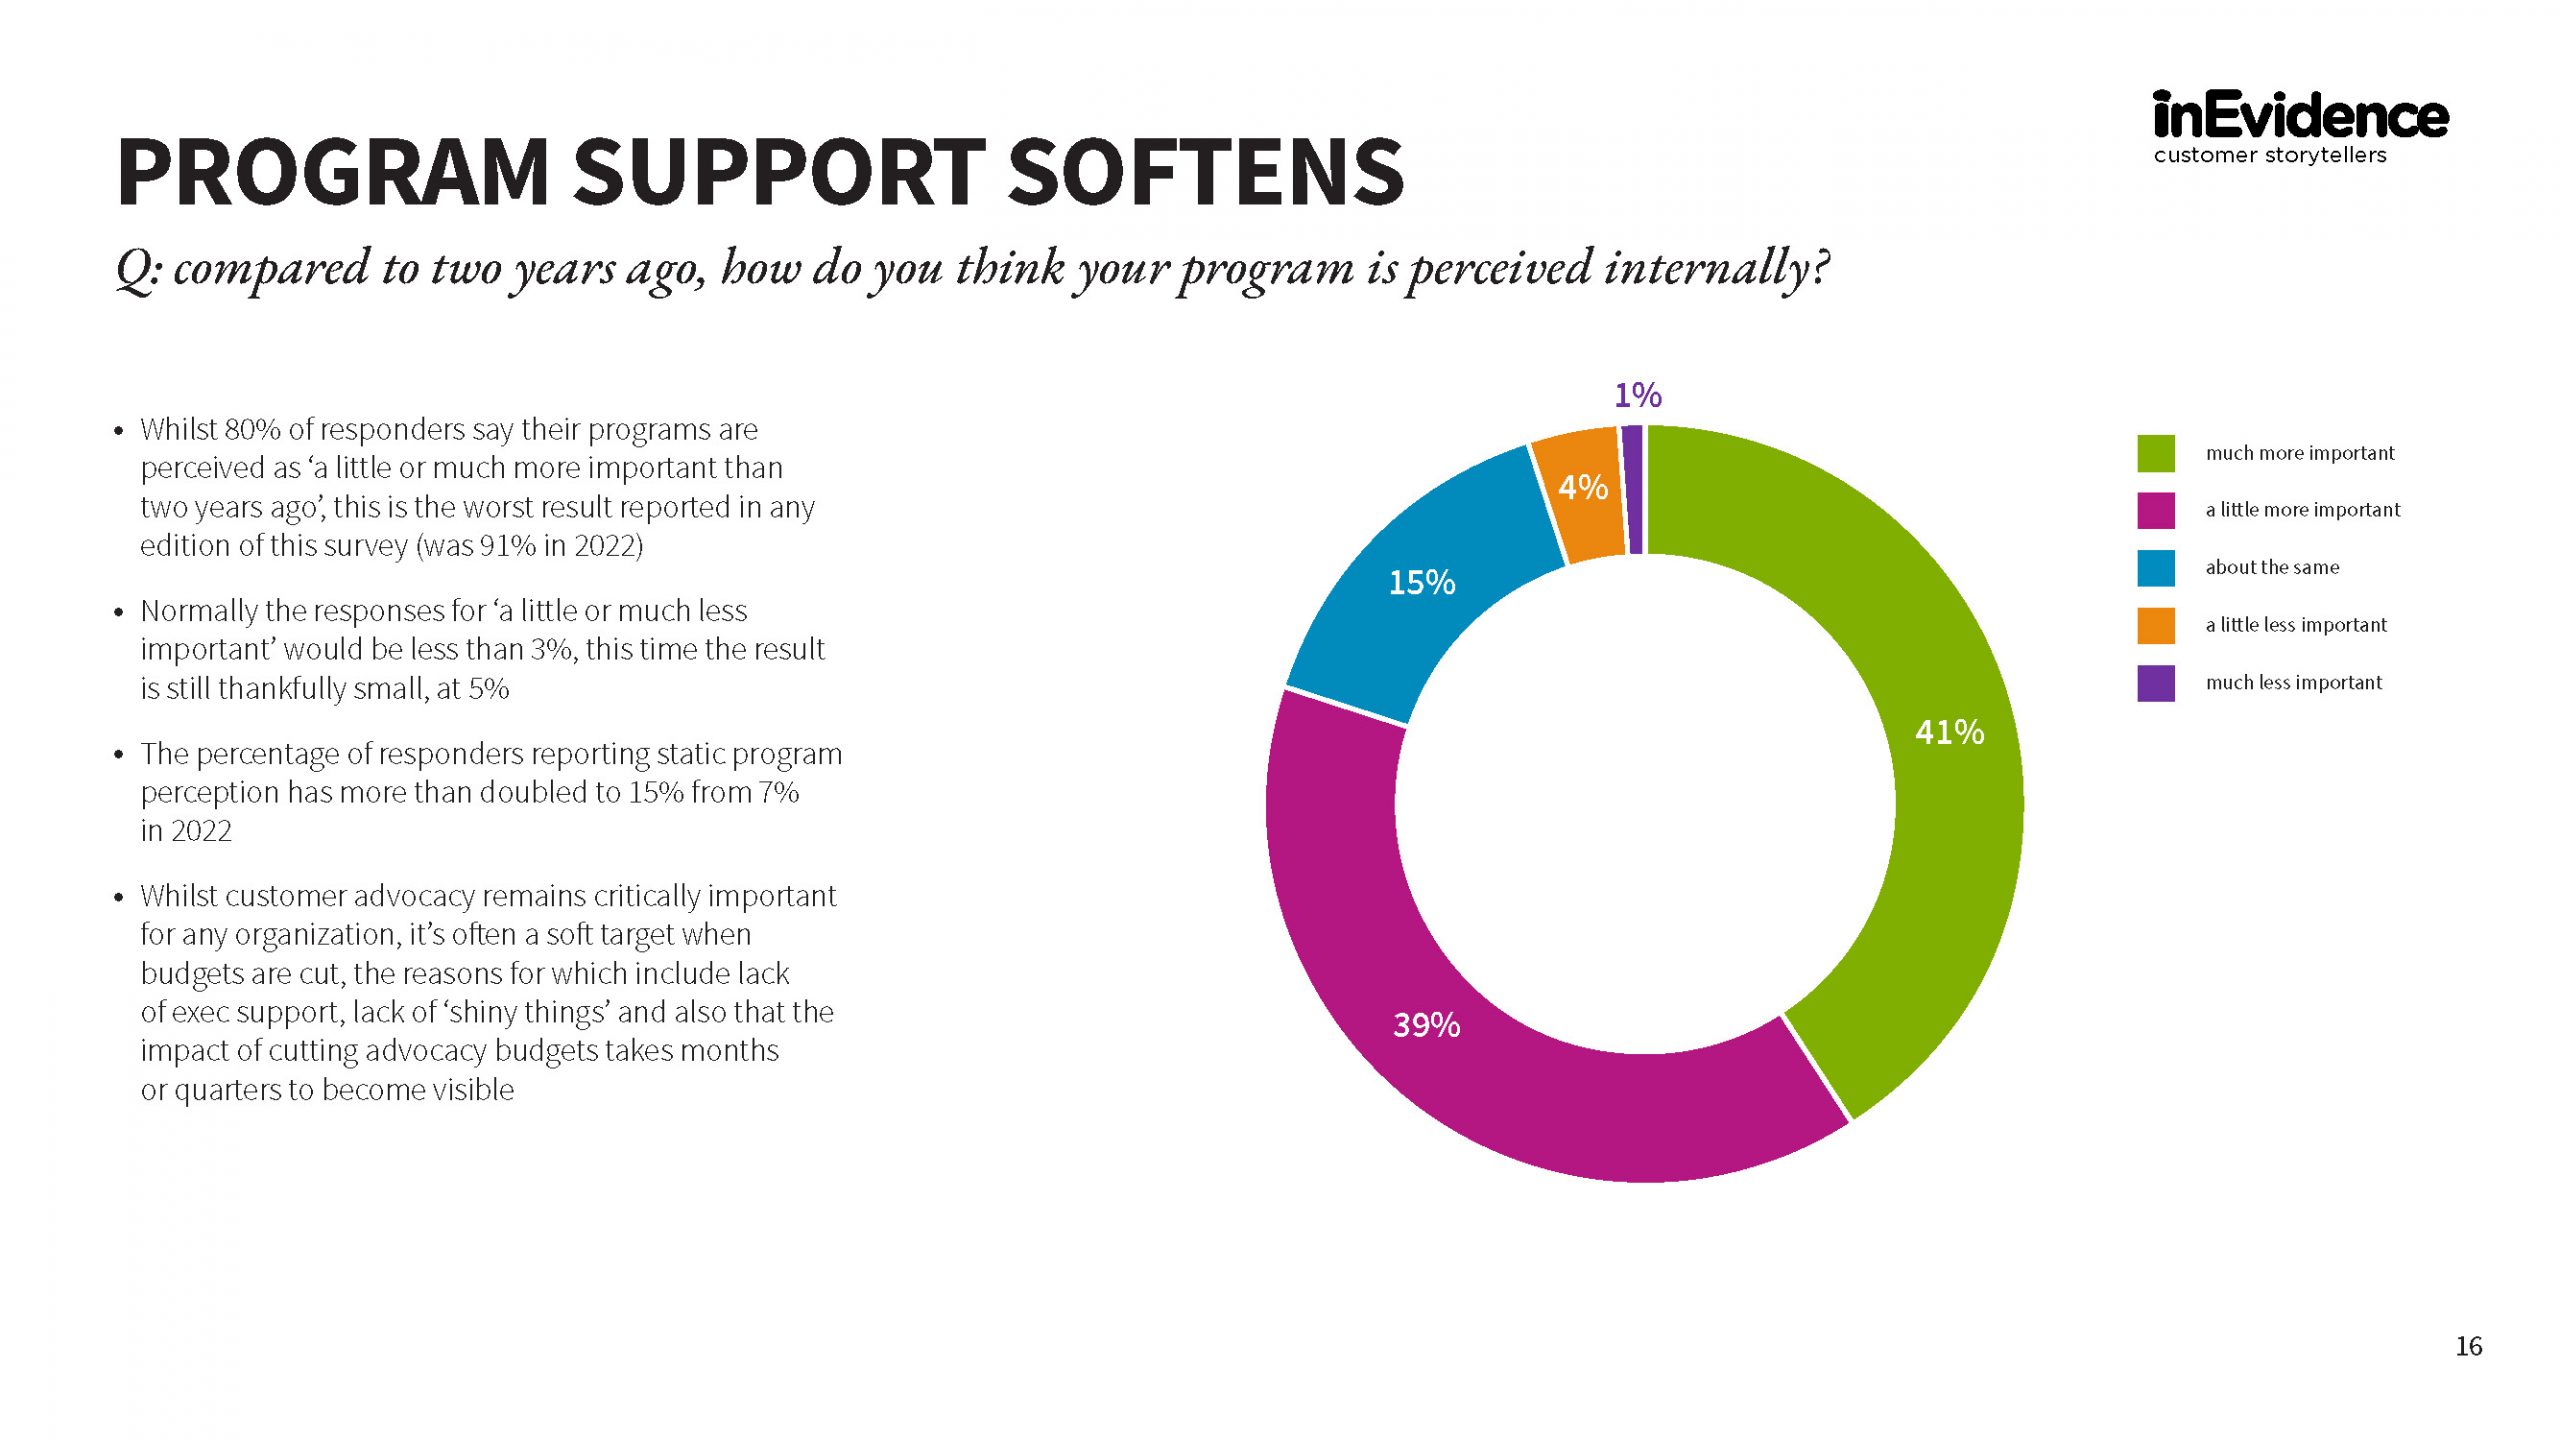
80% of responders state their programs are viewed as more important than 24 months prior, however this is down from 91%, the worst ever result.
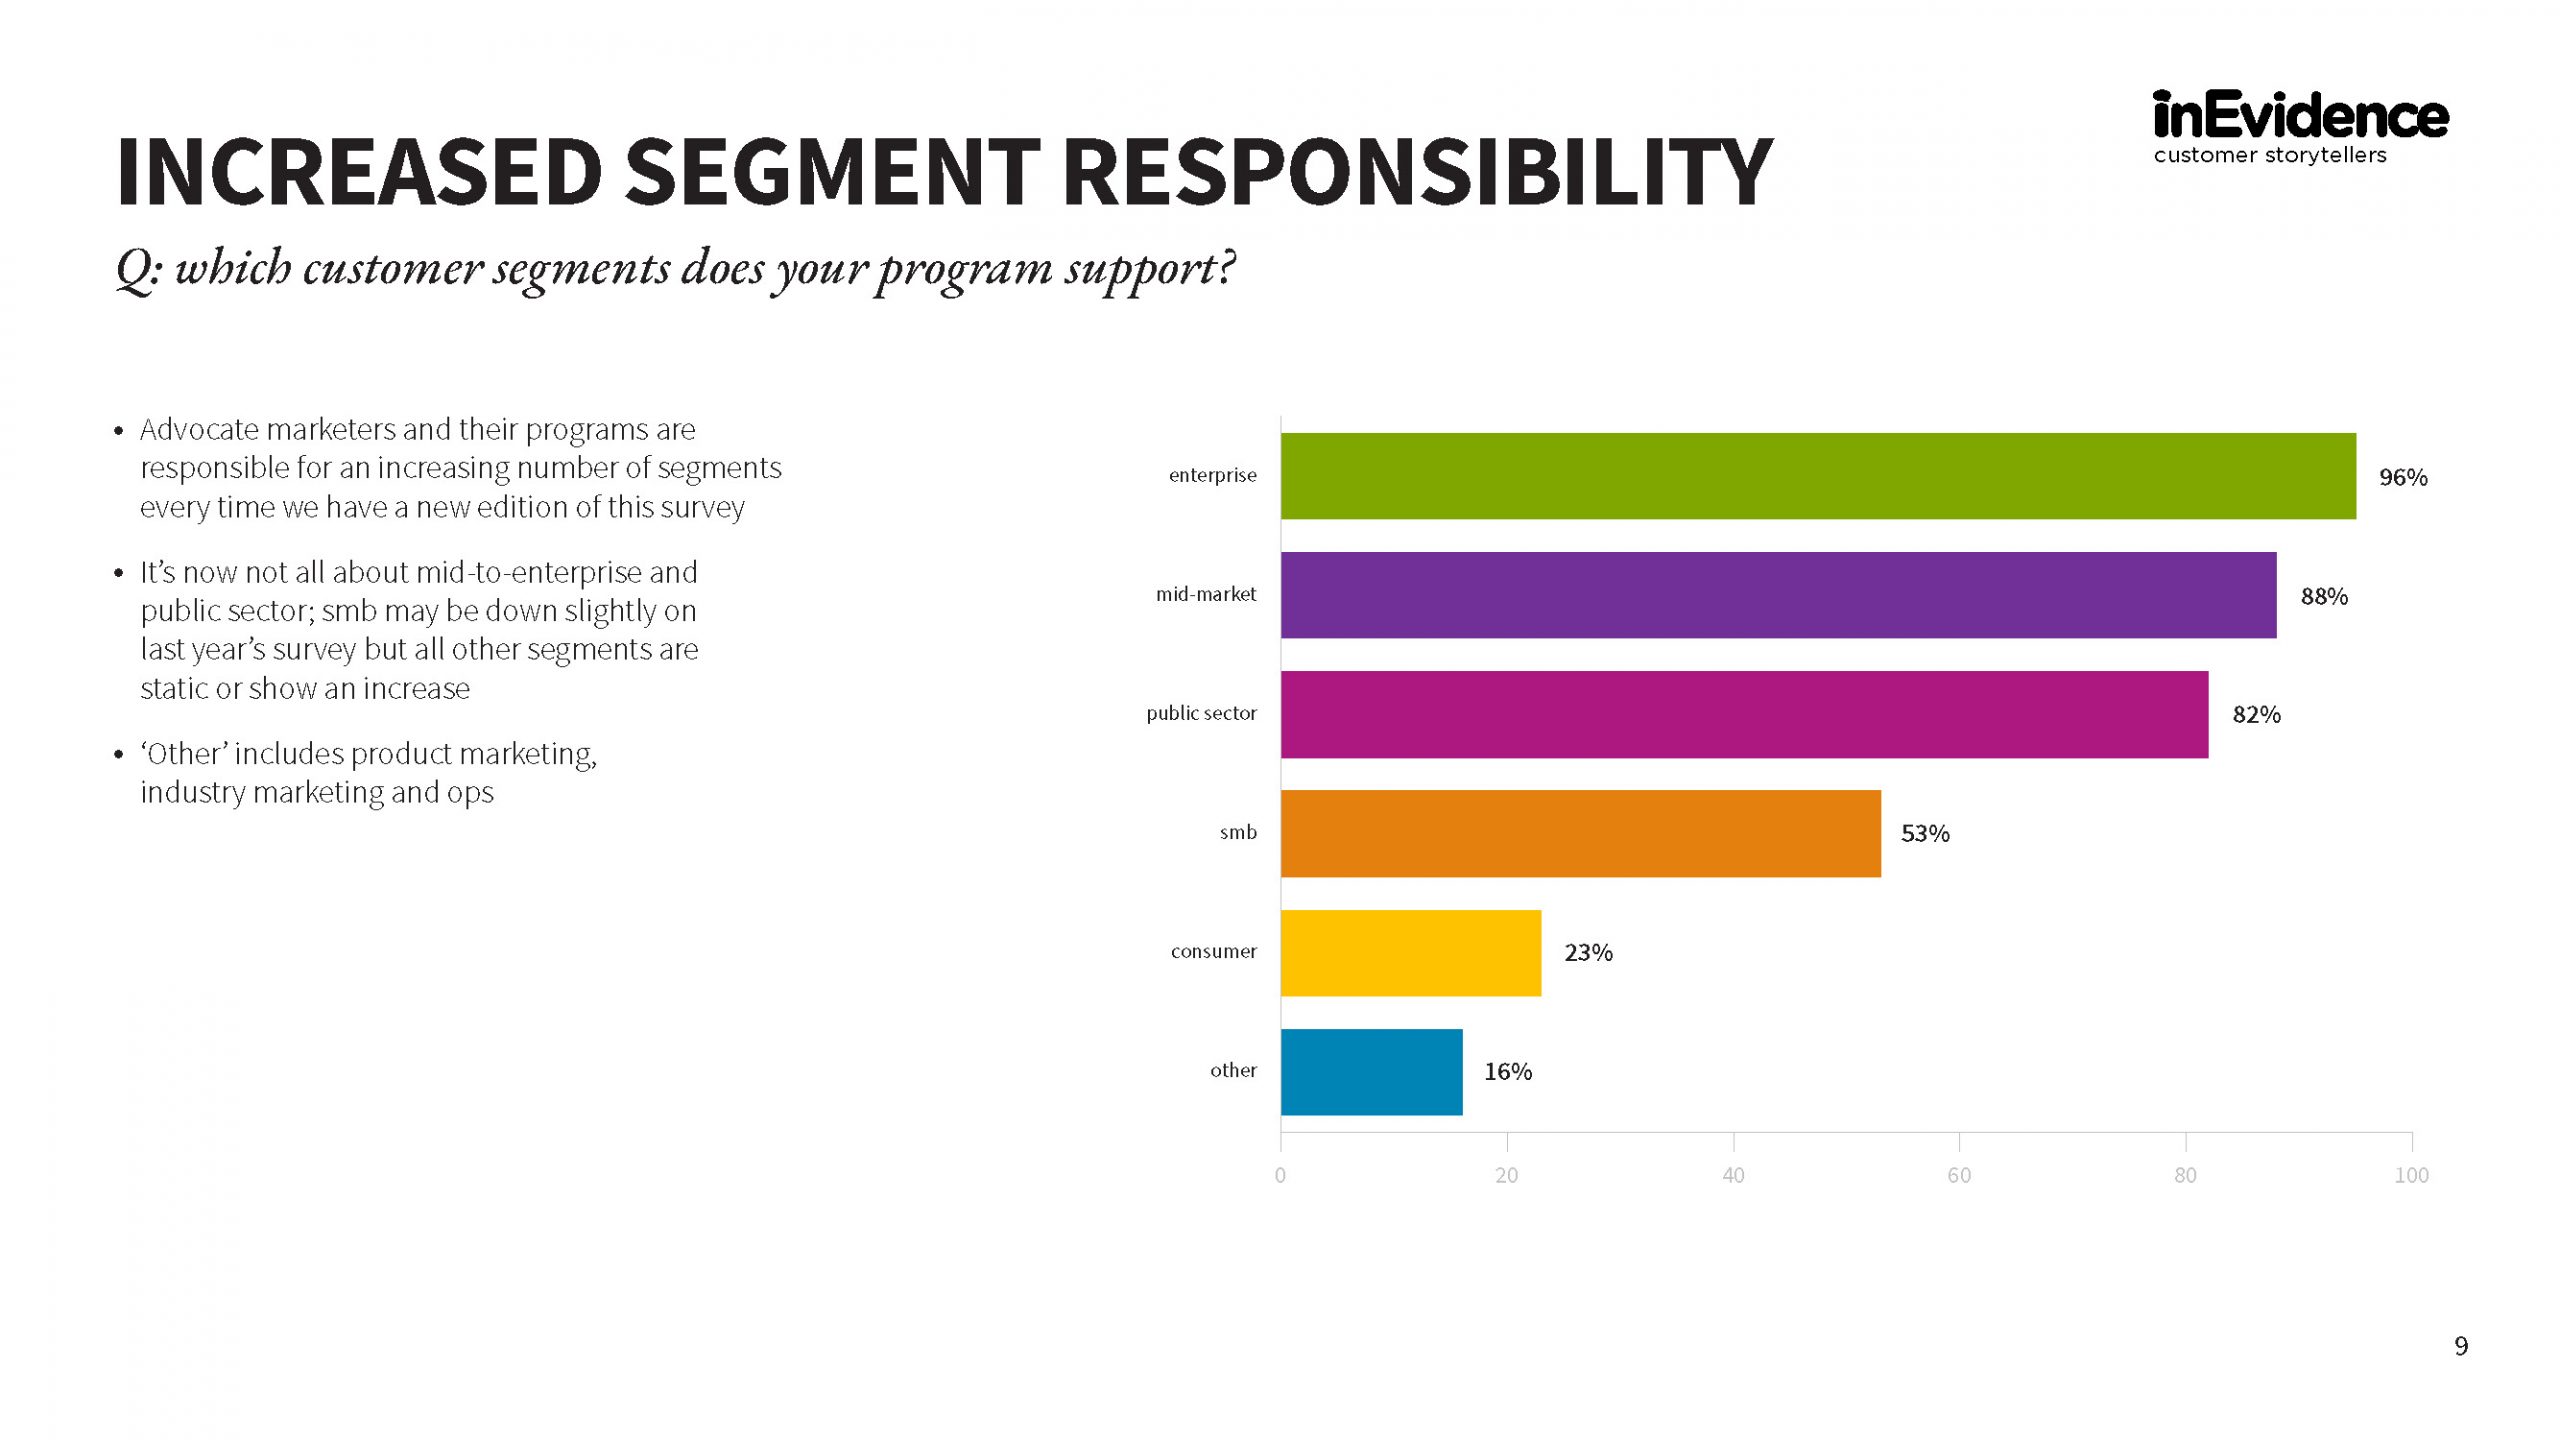
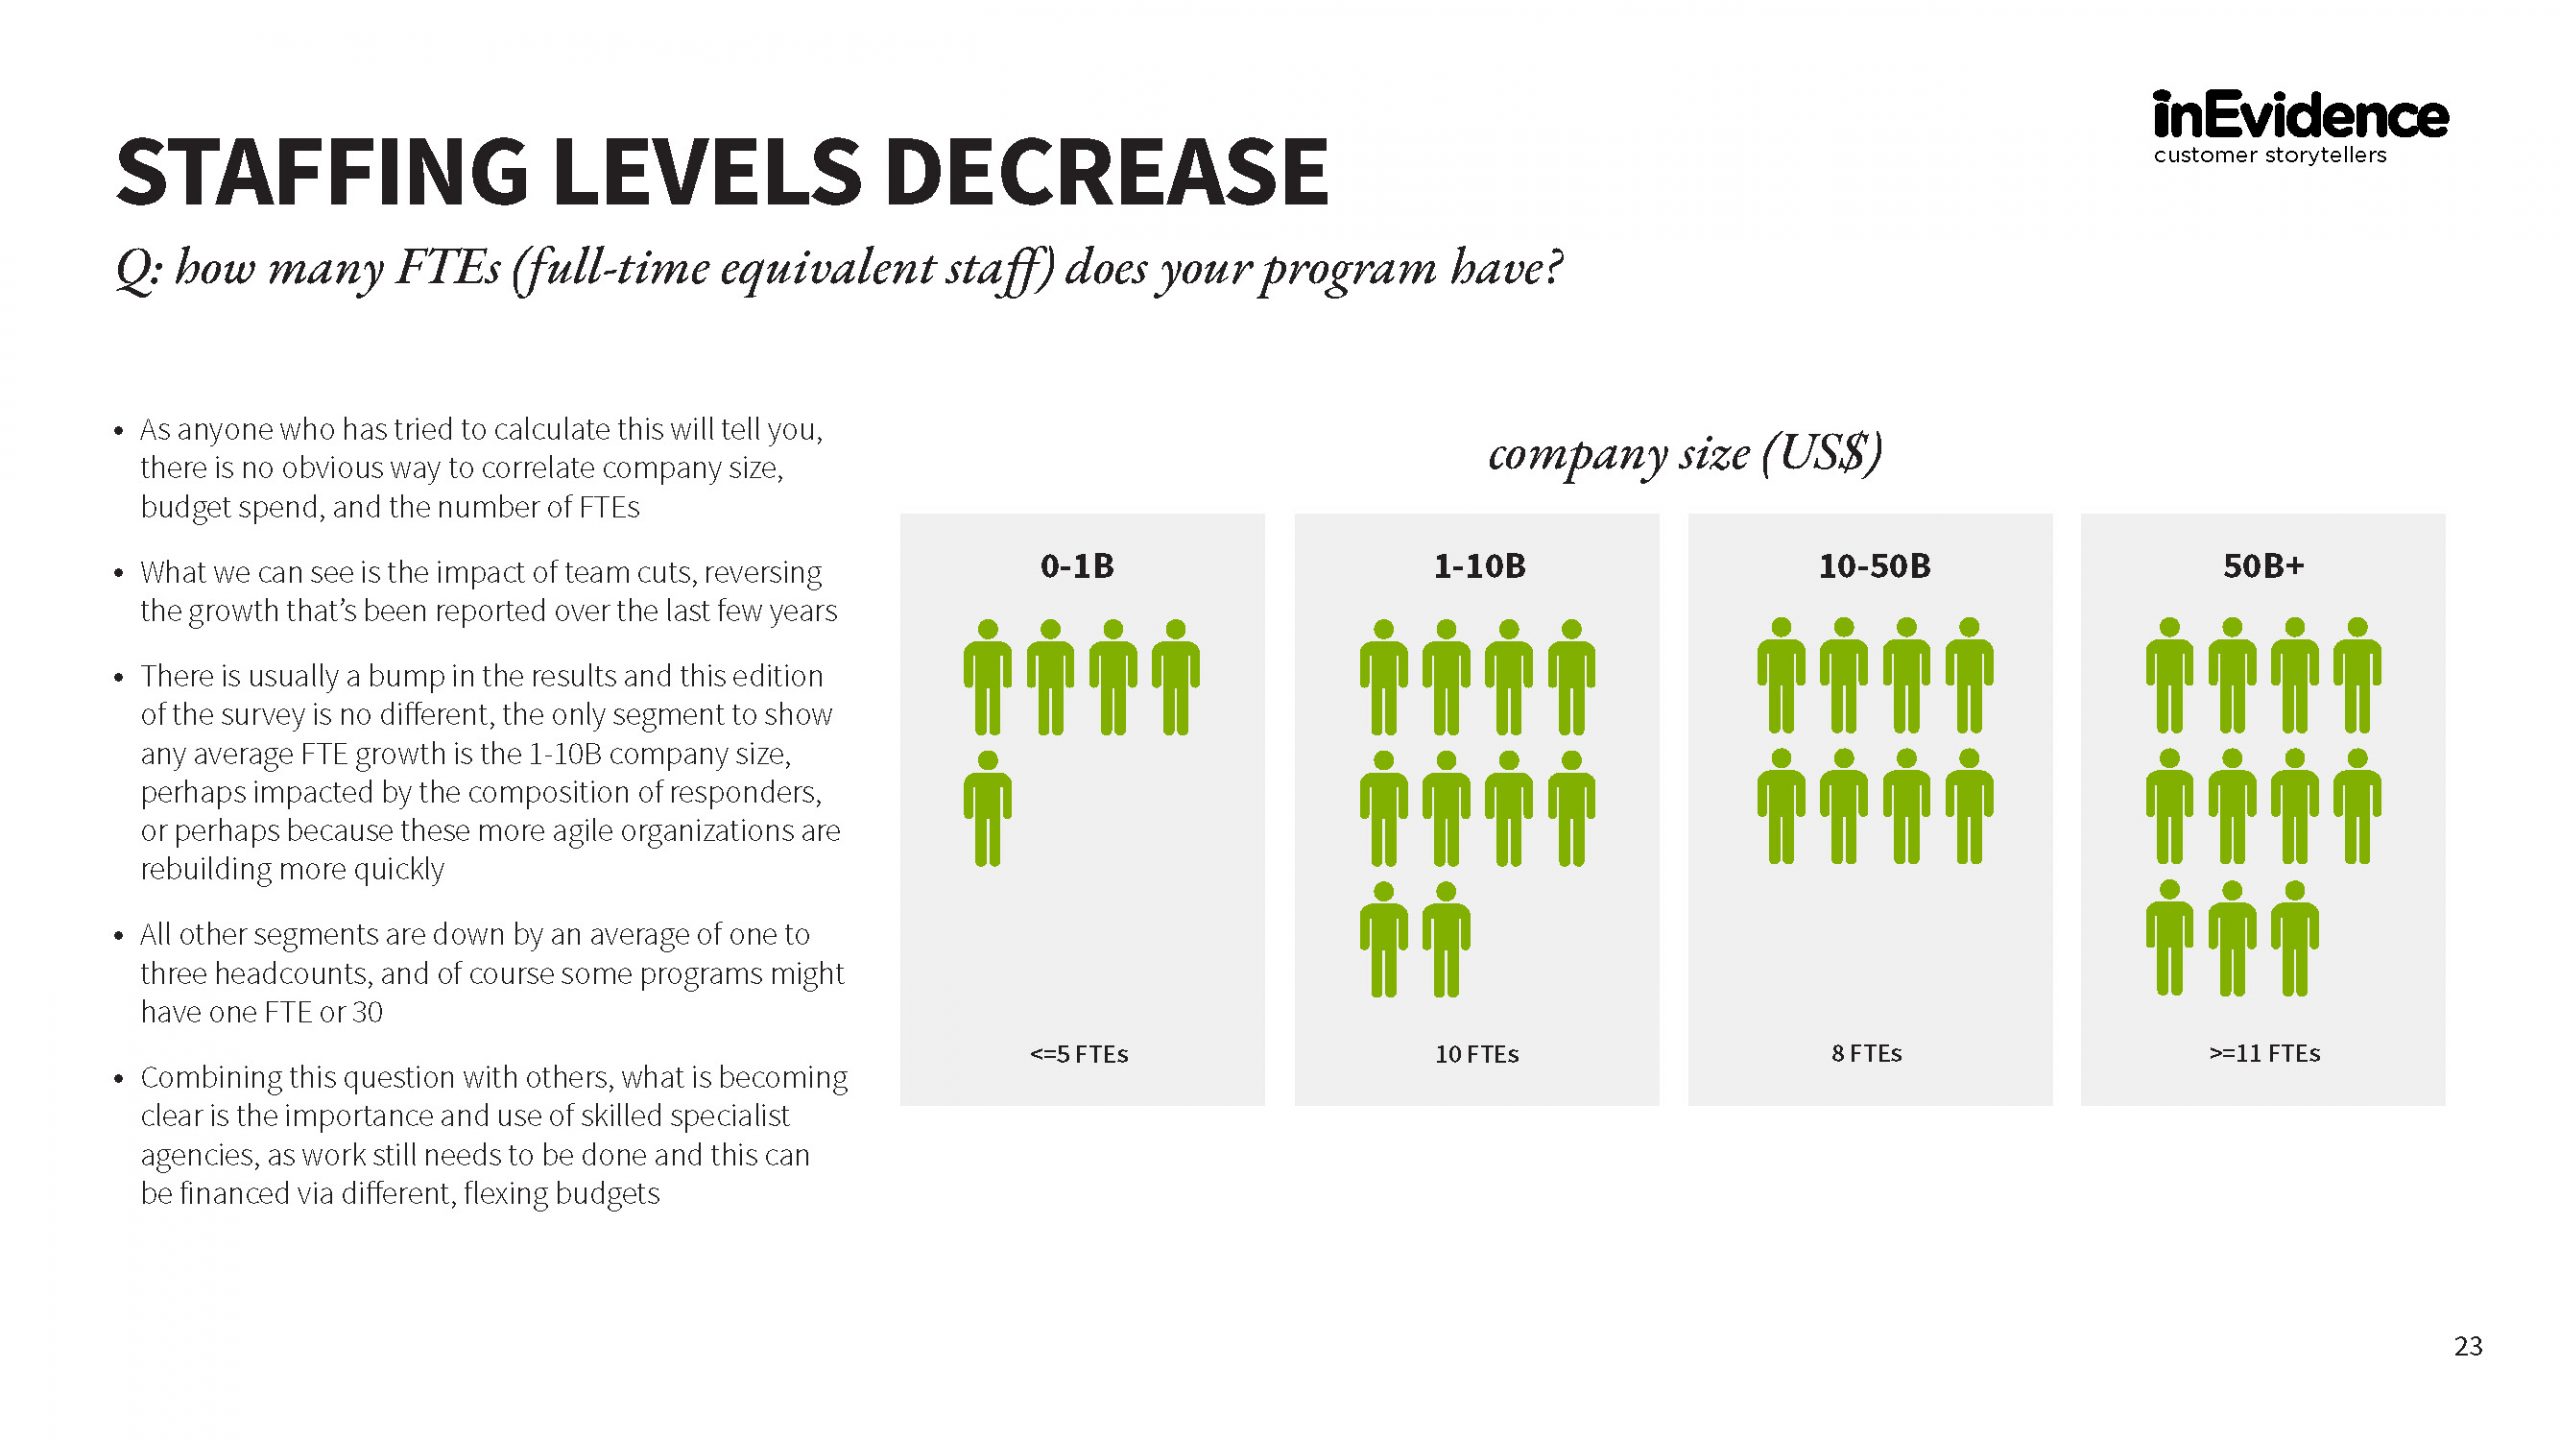
It’s the same story from a resourcing perspective, apart from companies of $1B to $10B in size, all other segments are down by an average of one to three FTEs.
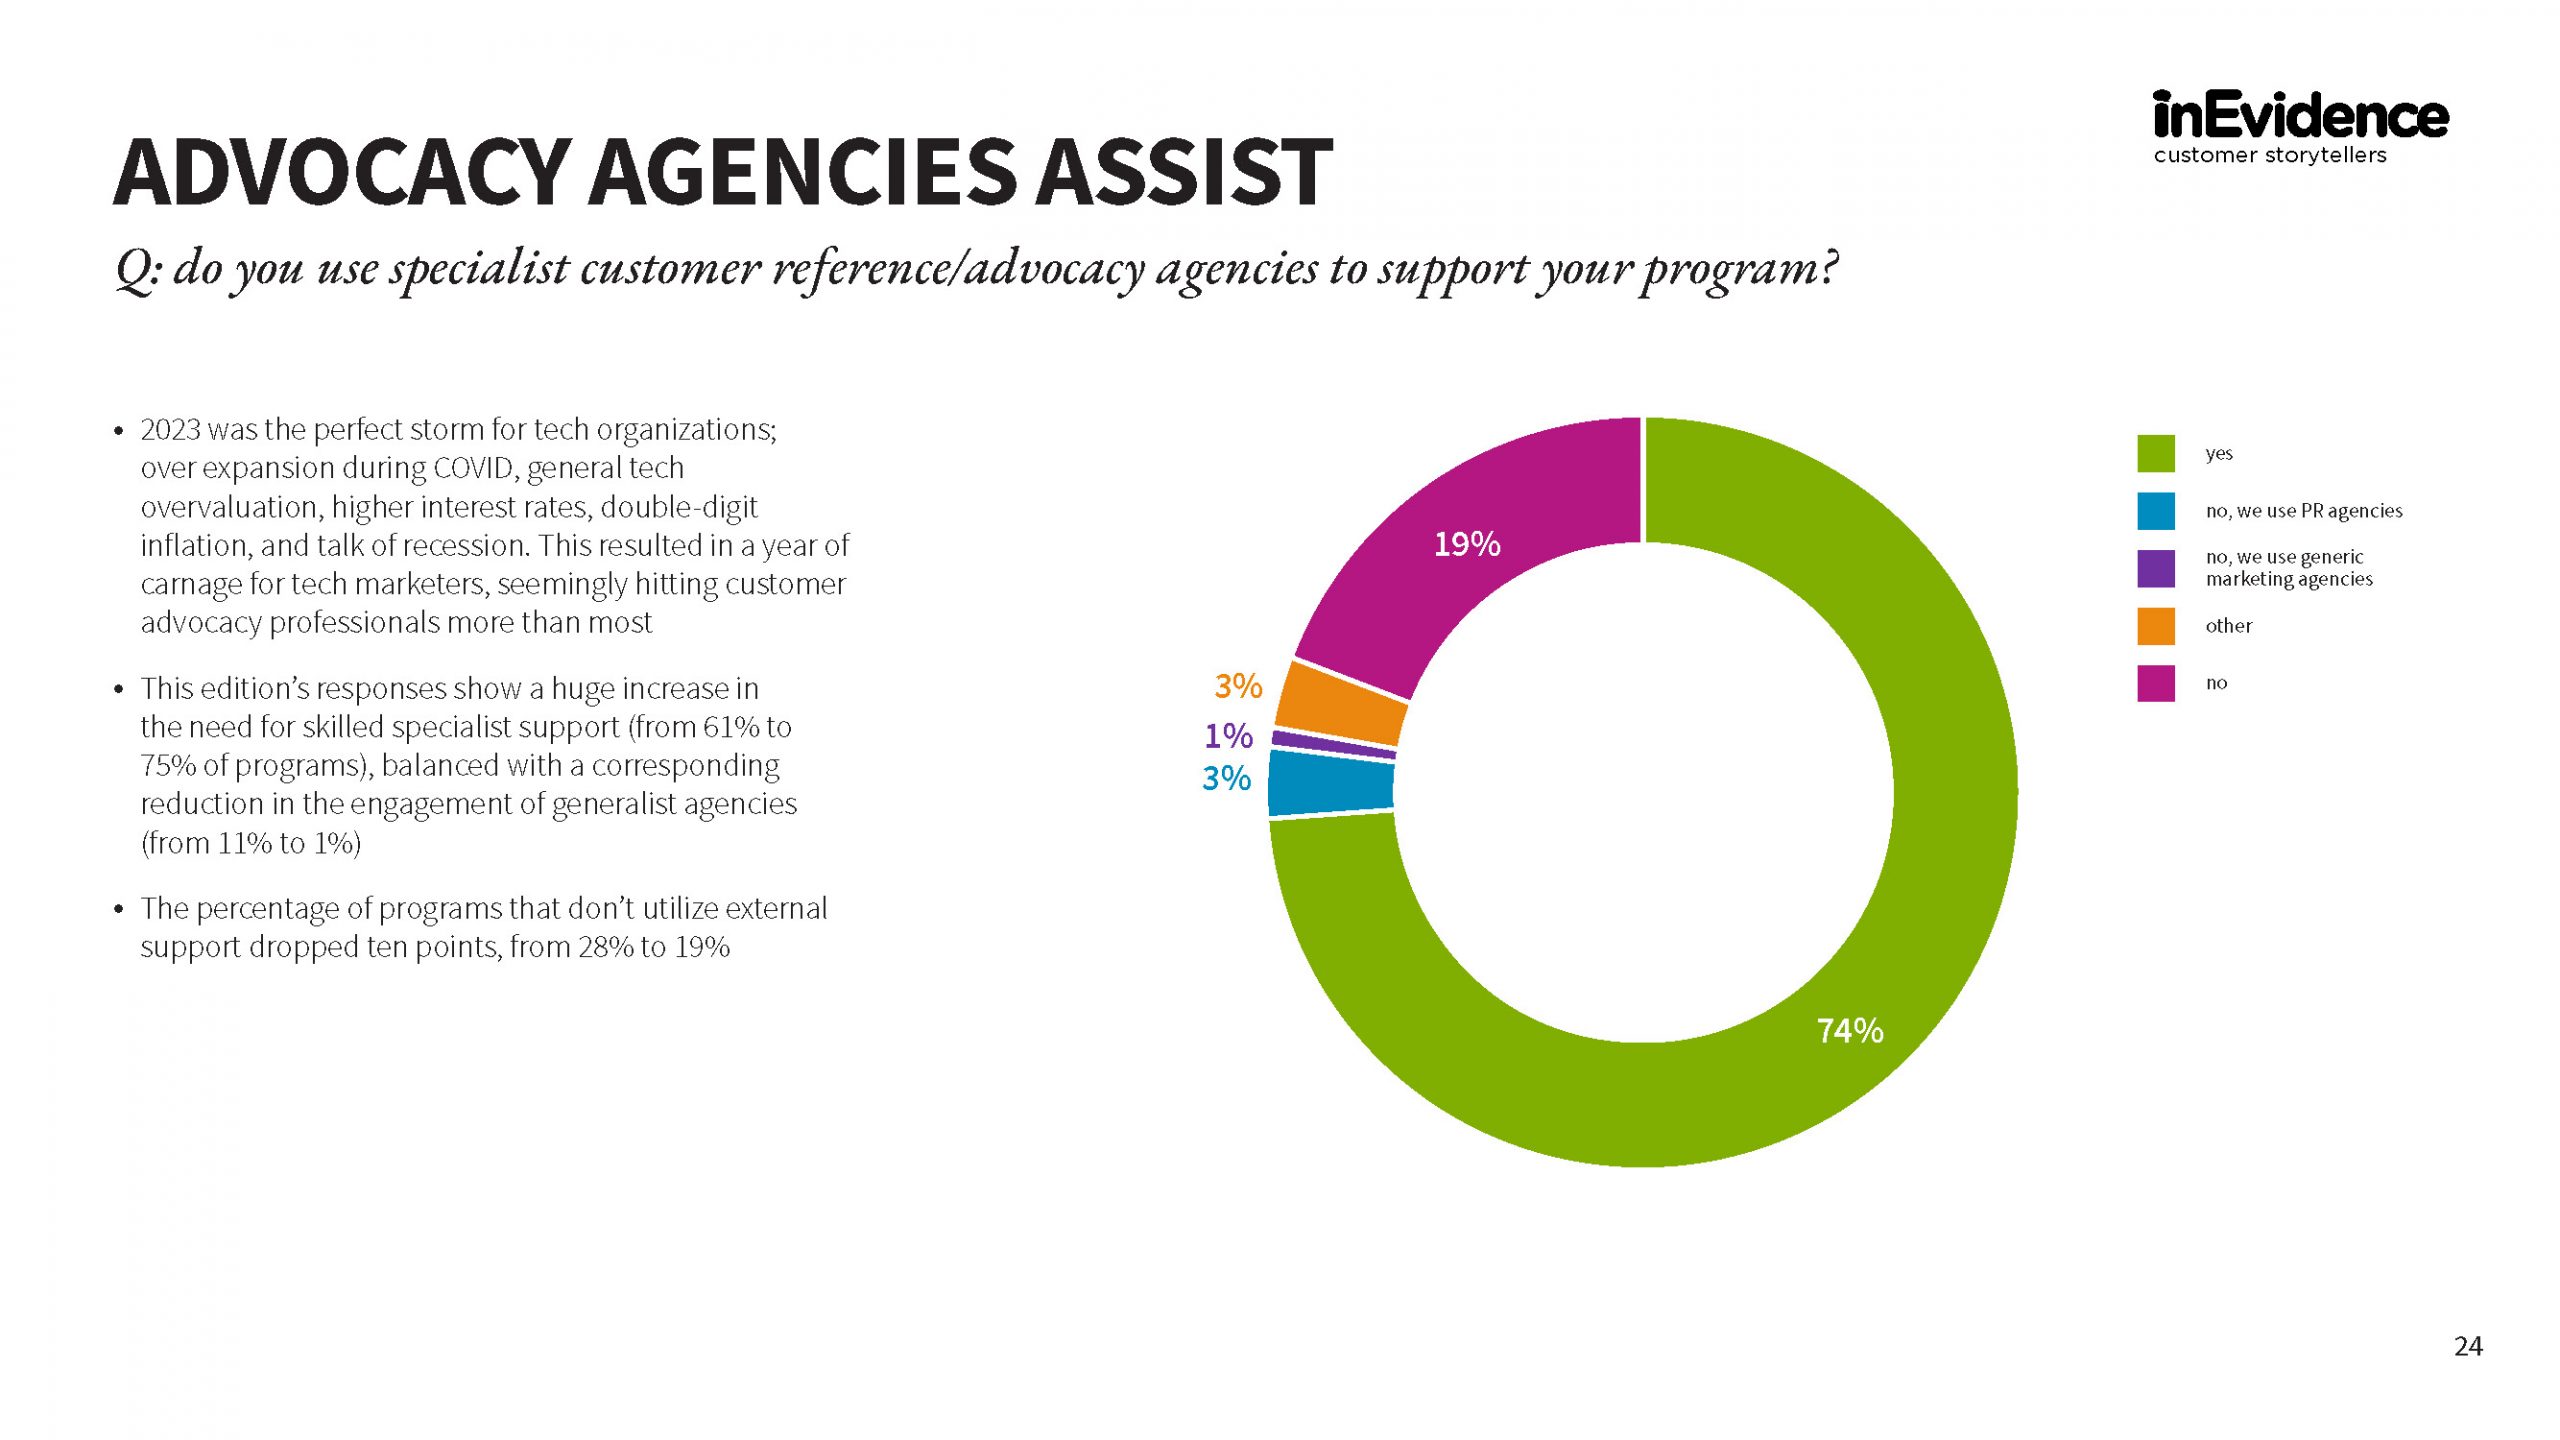
Unsurprisingly, specialist and flexible agency skill is more in demand than ever.
It’s sobering reading, yet there are signs the reset has occurred and 2024 will have far more opportunity.
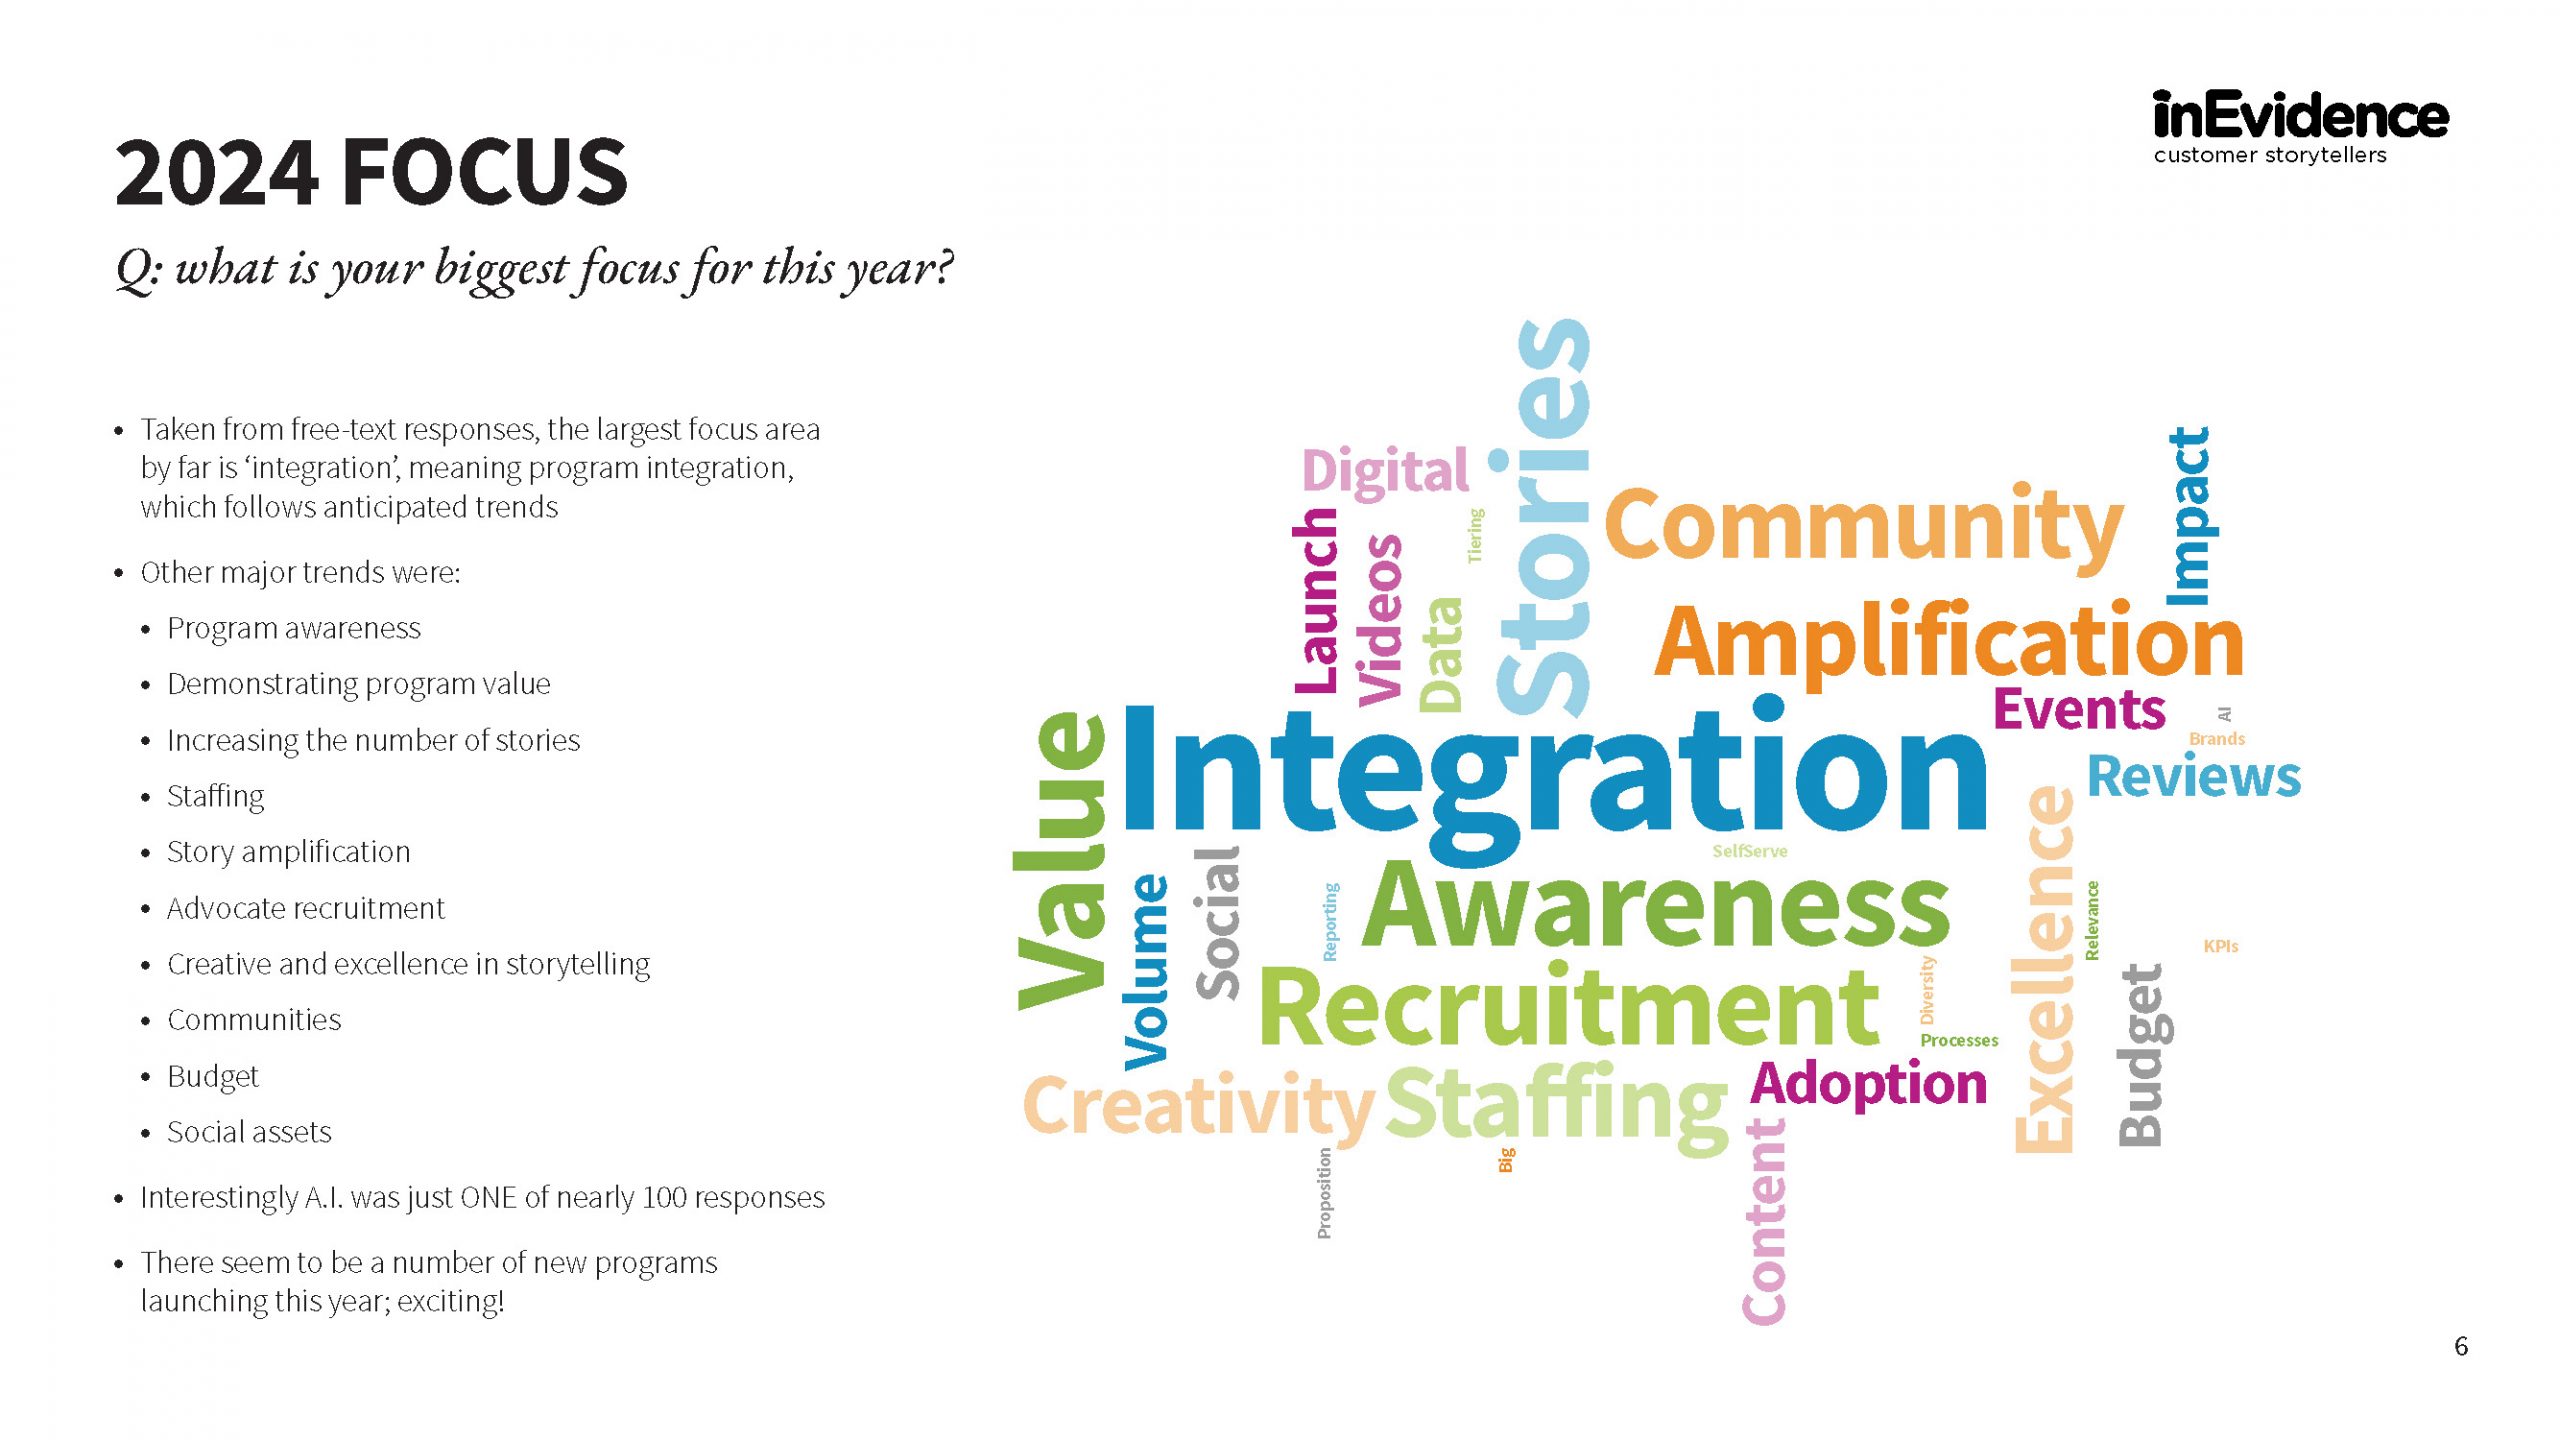
2. Alignment – still the largest focus
Program alignment is key; hardly surprising when one considers needs and complexity of marketing in 2024.
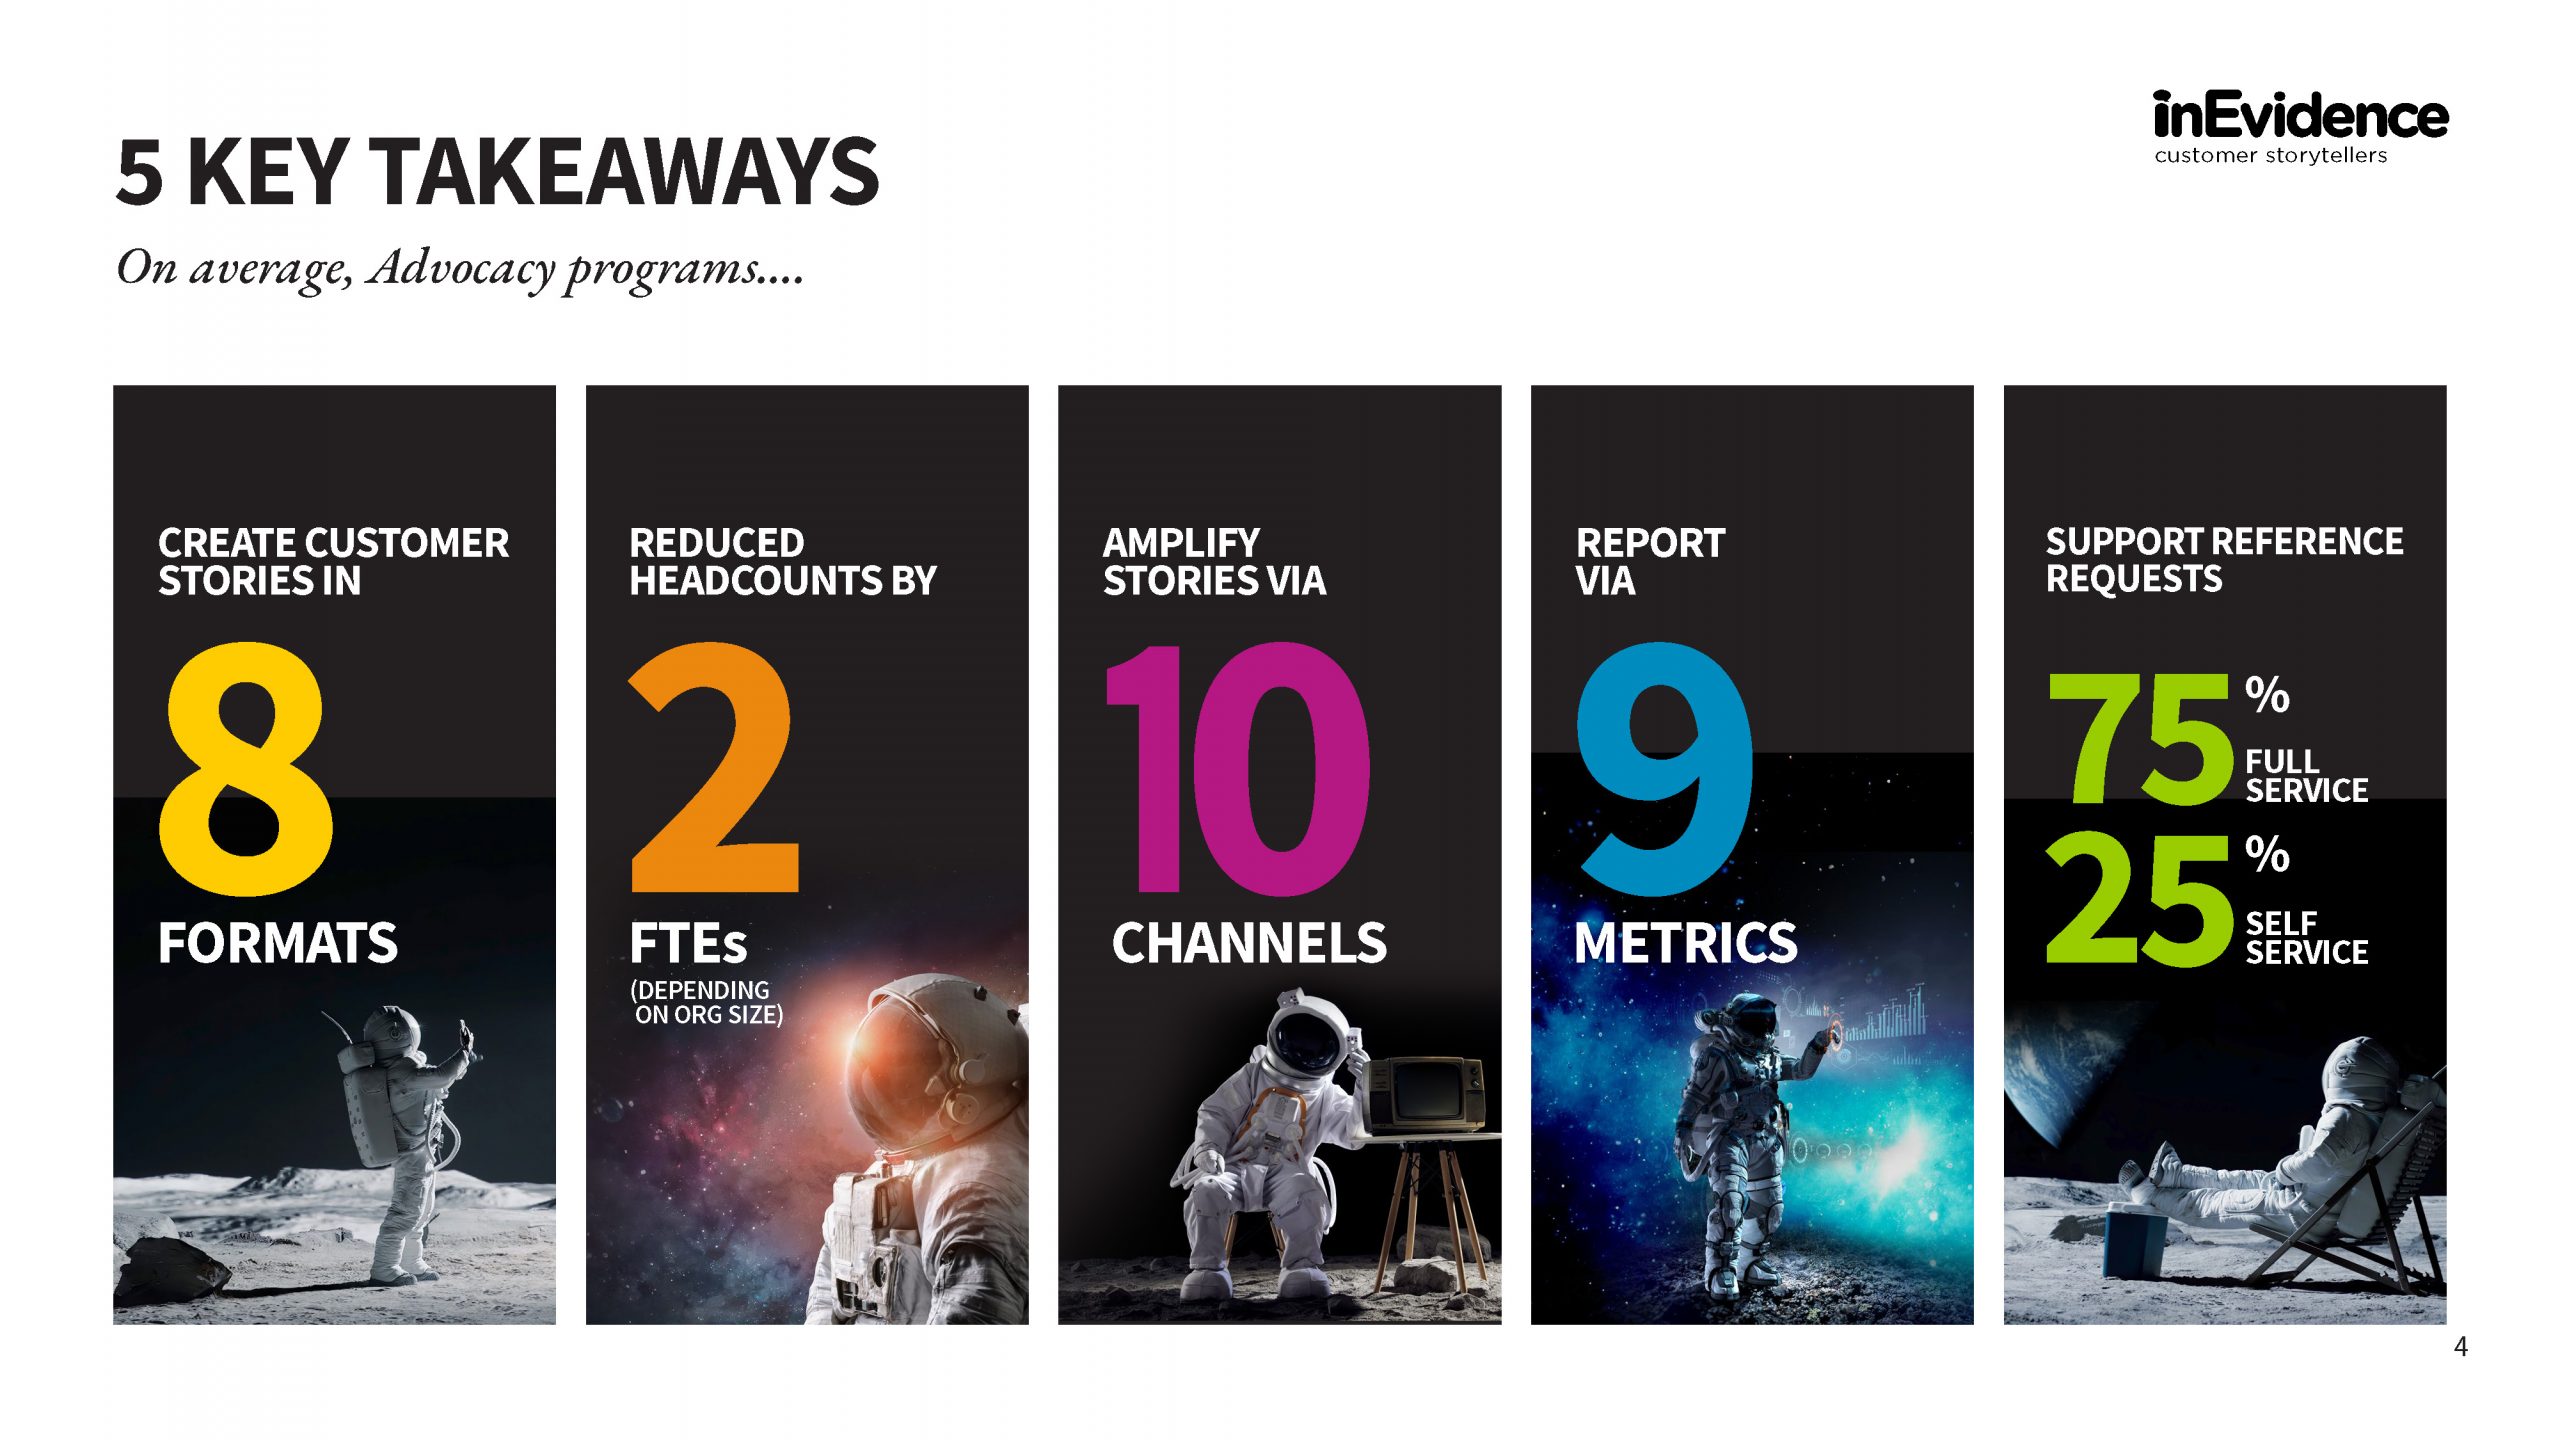
On average, programs now:
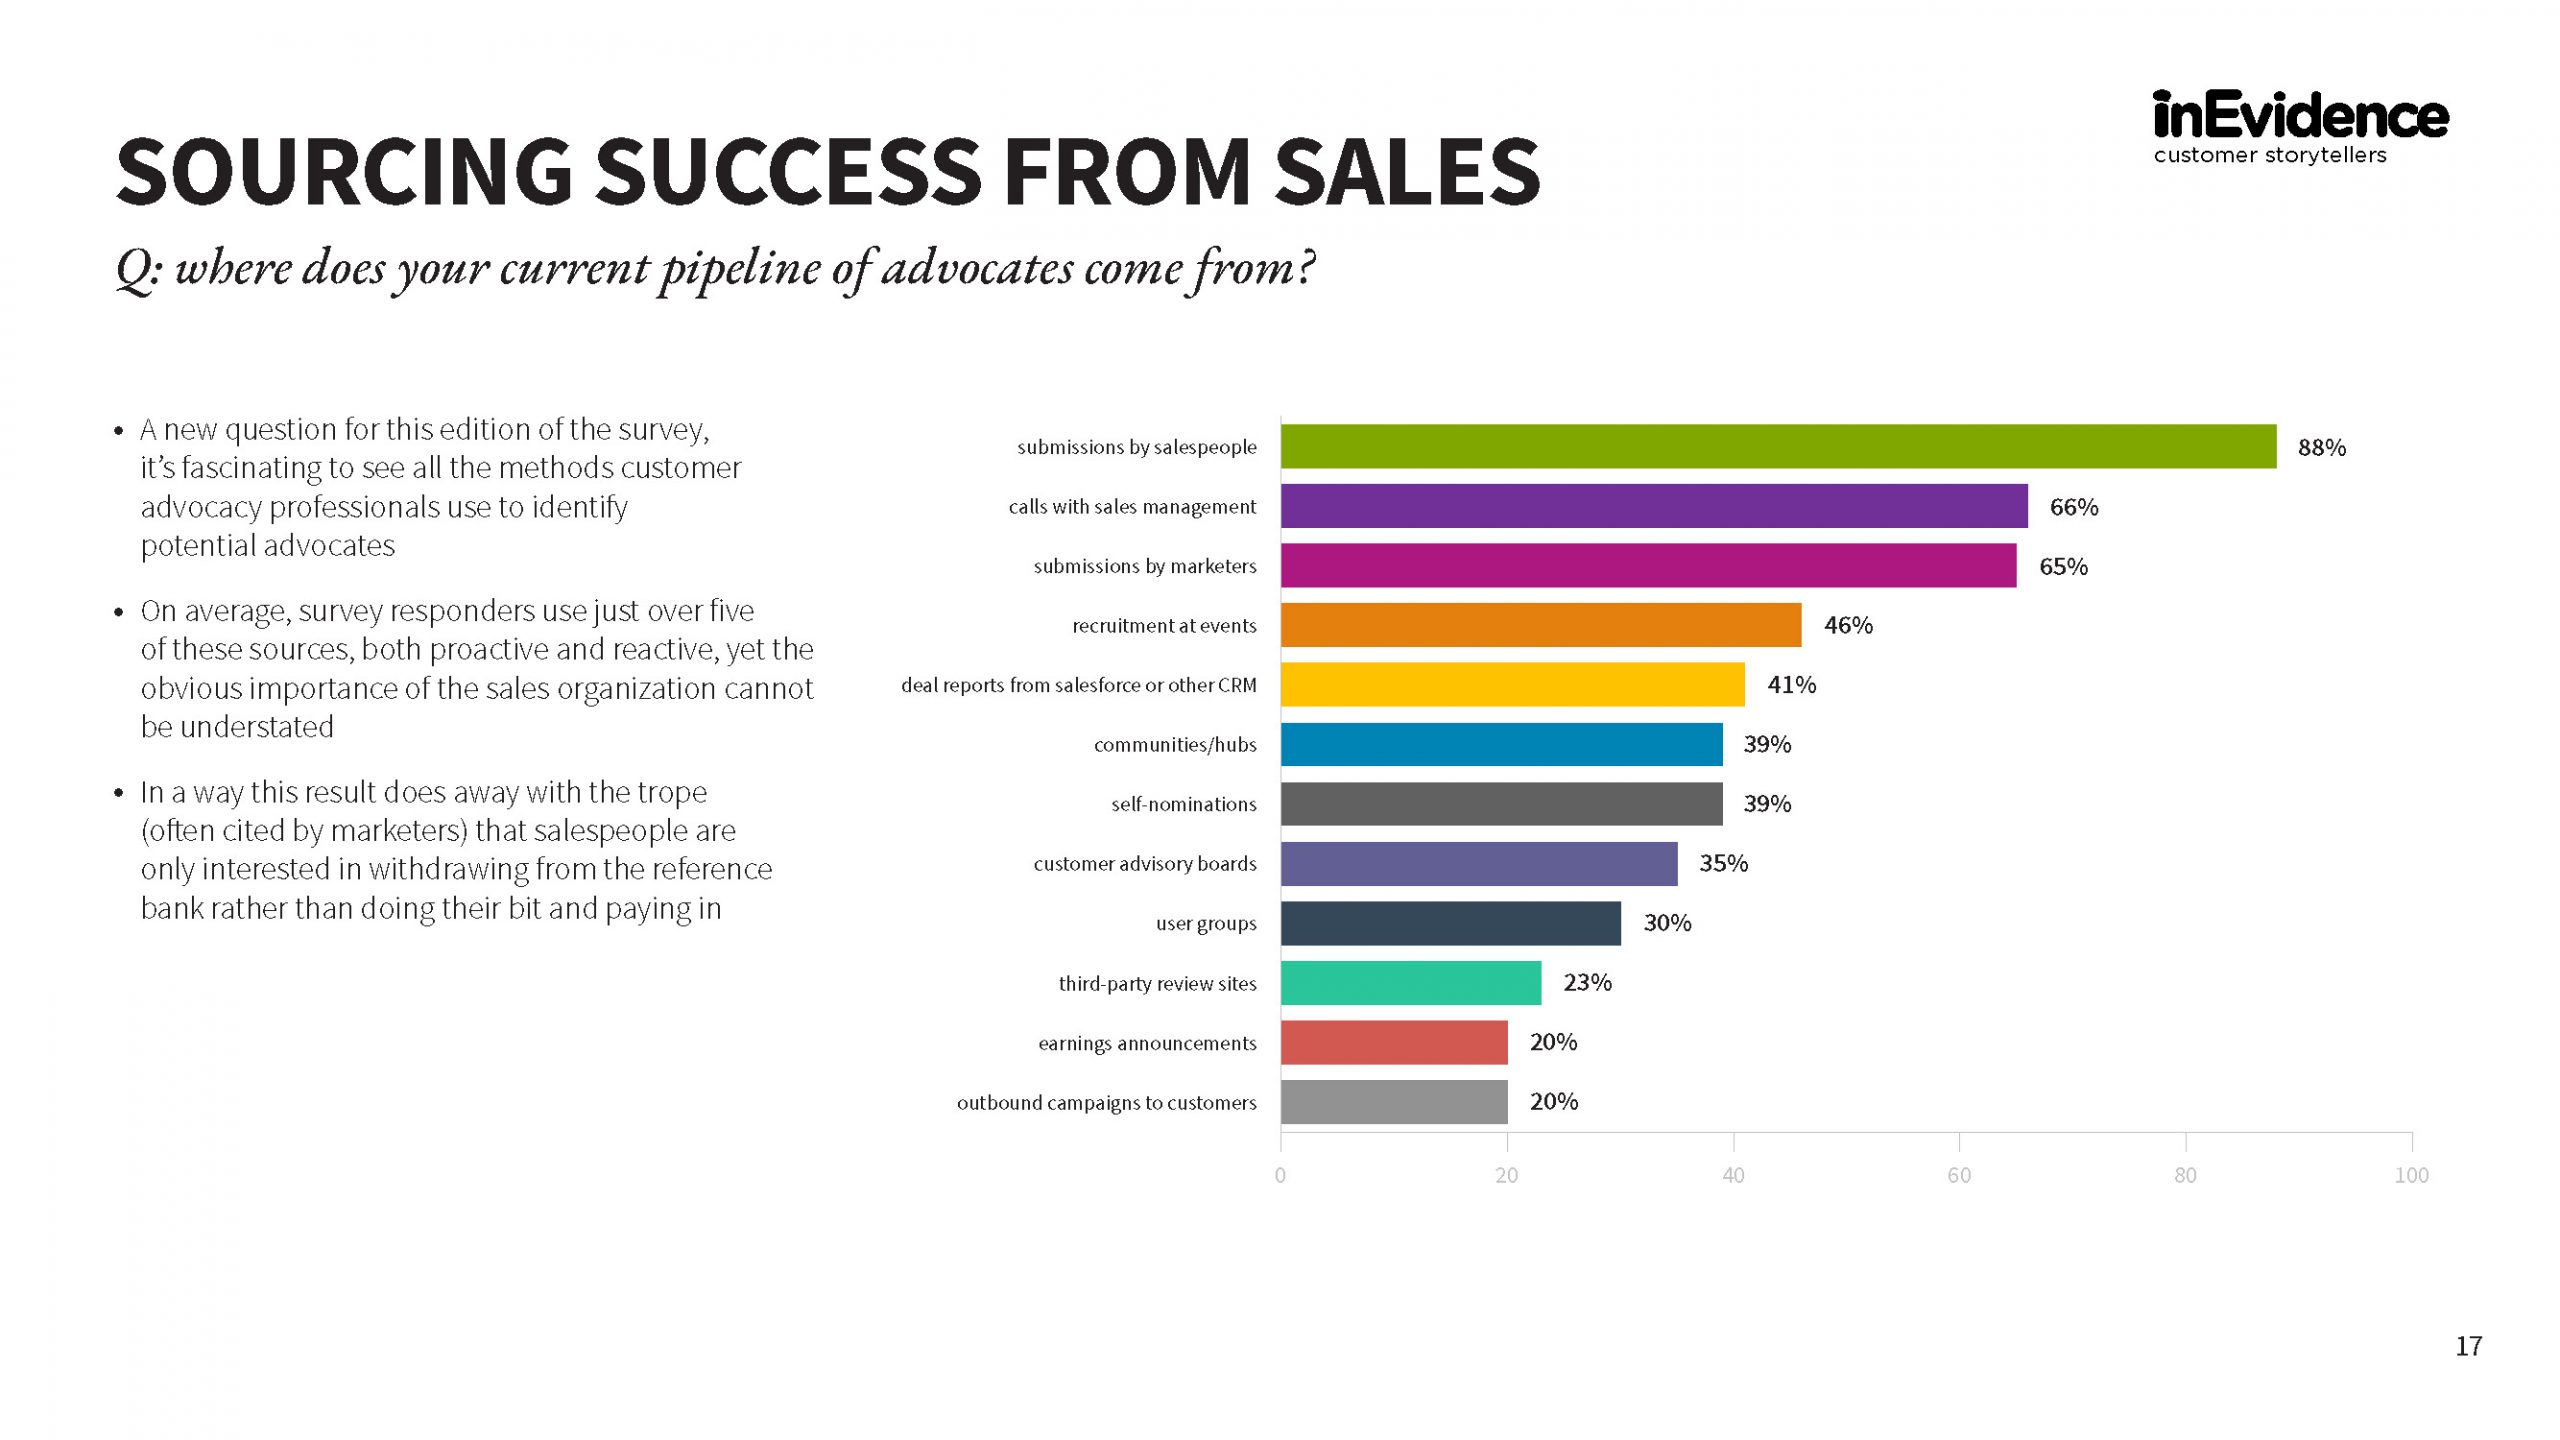
• Recruit advocates from five sources
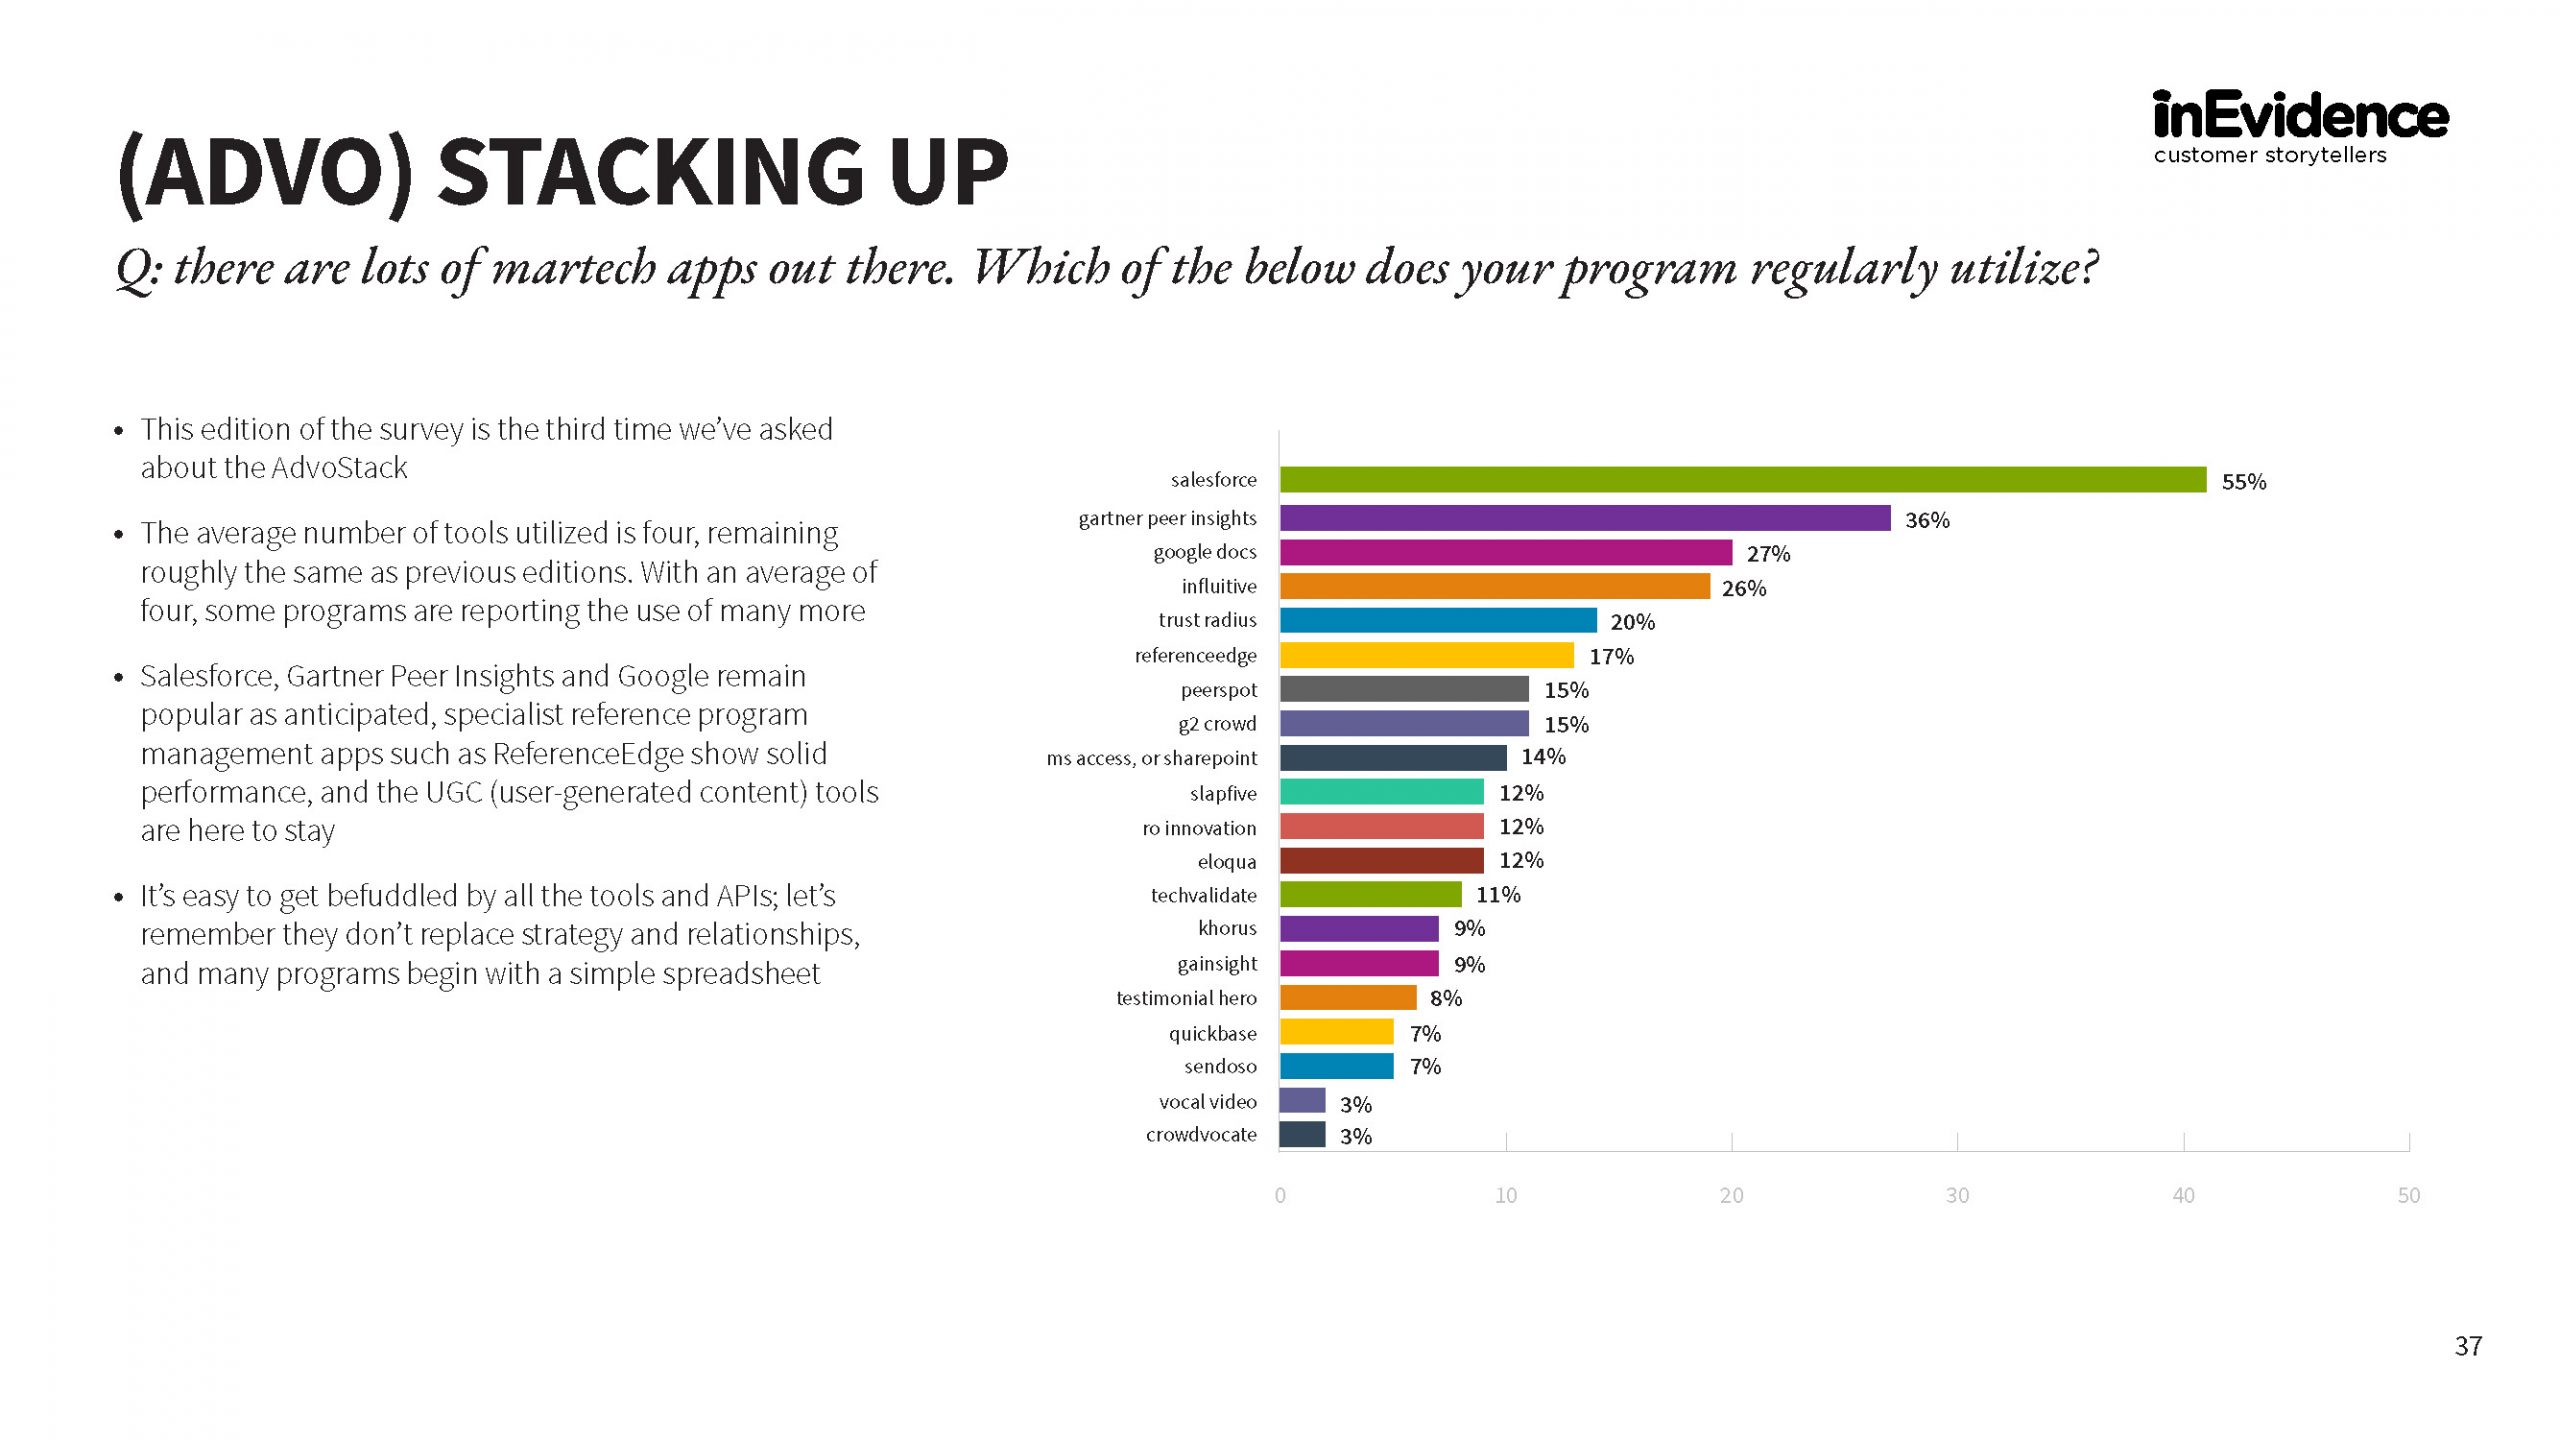
• Use four dedicated mar-tech tools
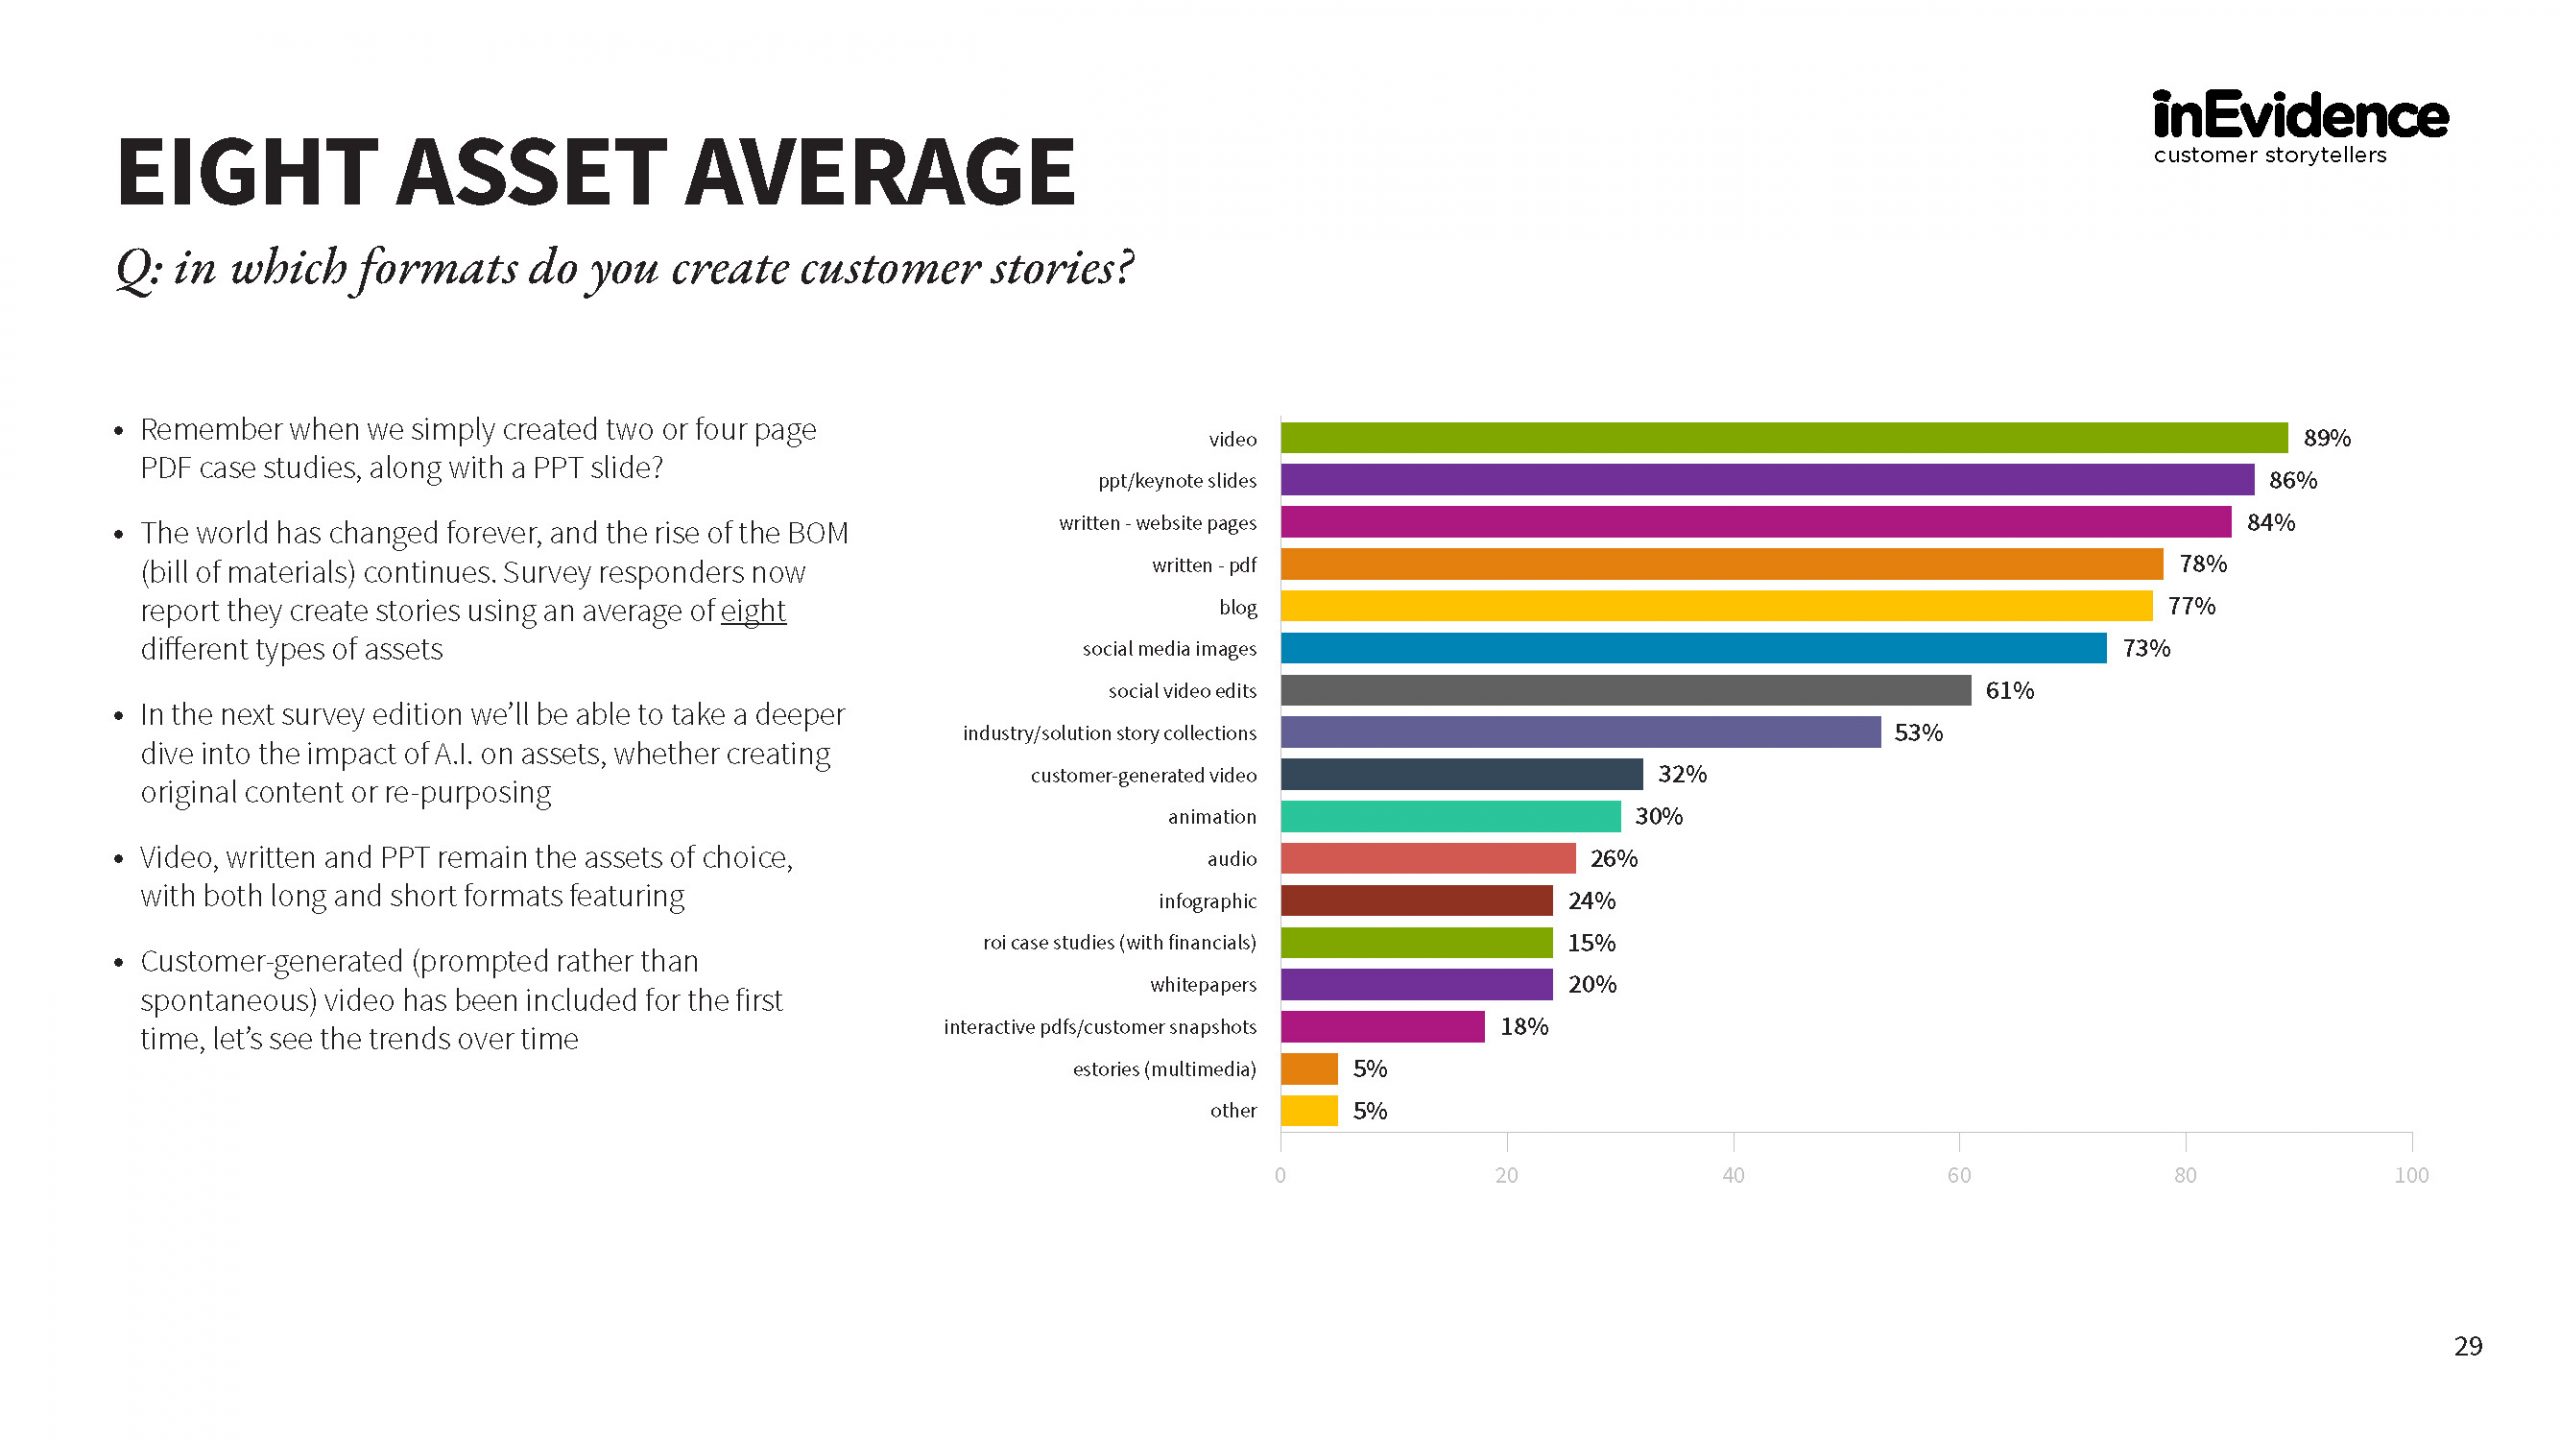
• Create eight story asset types
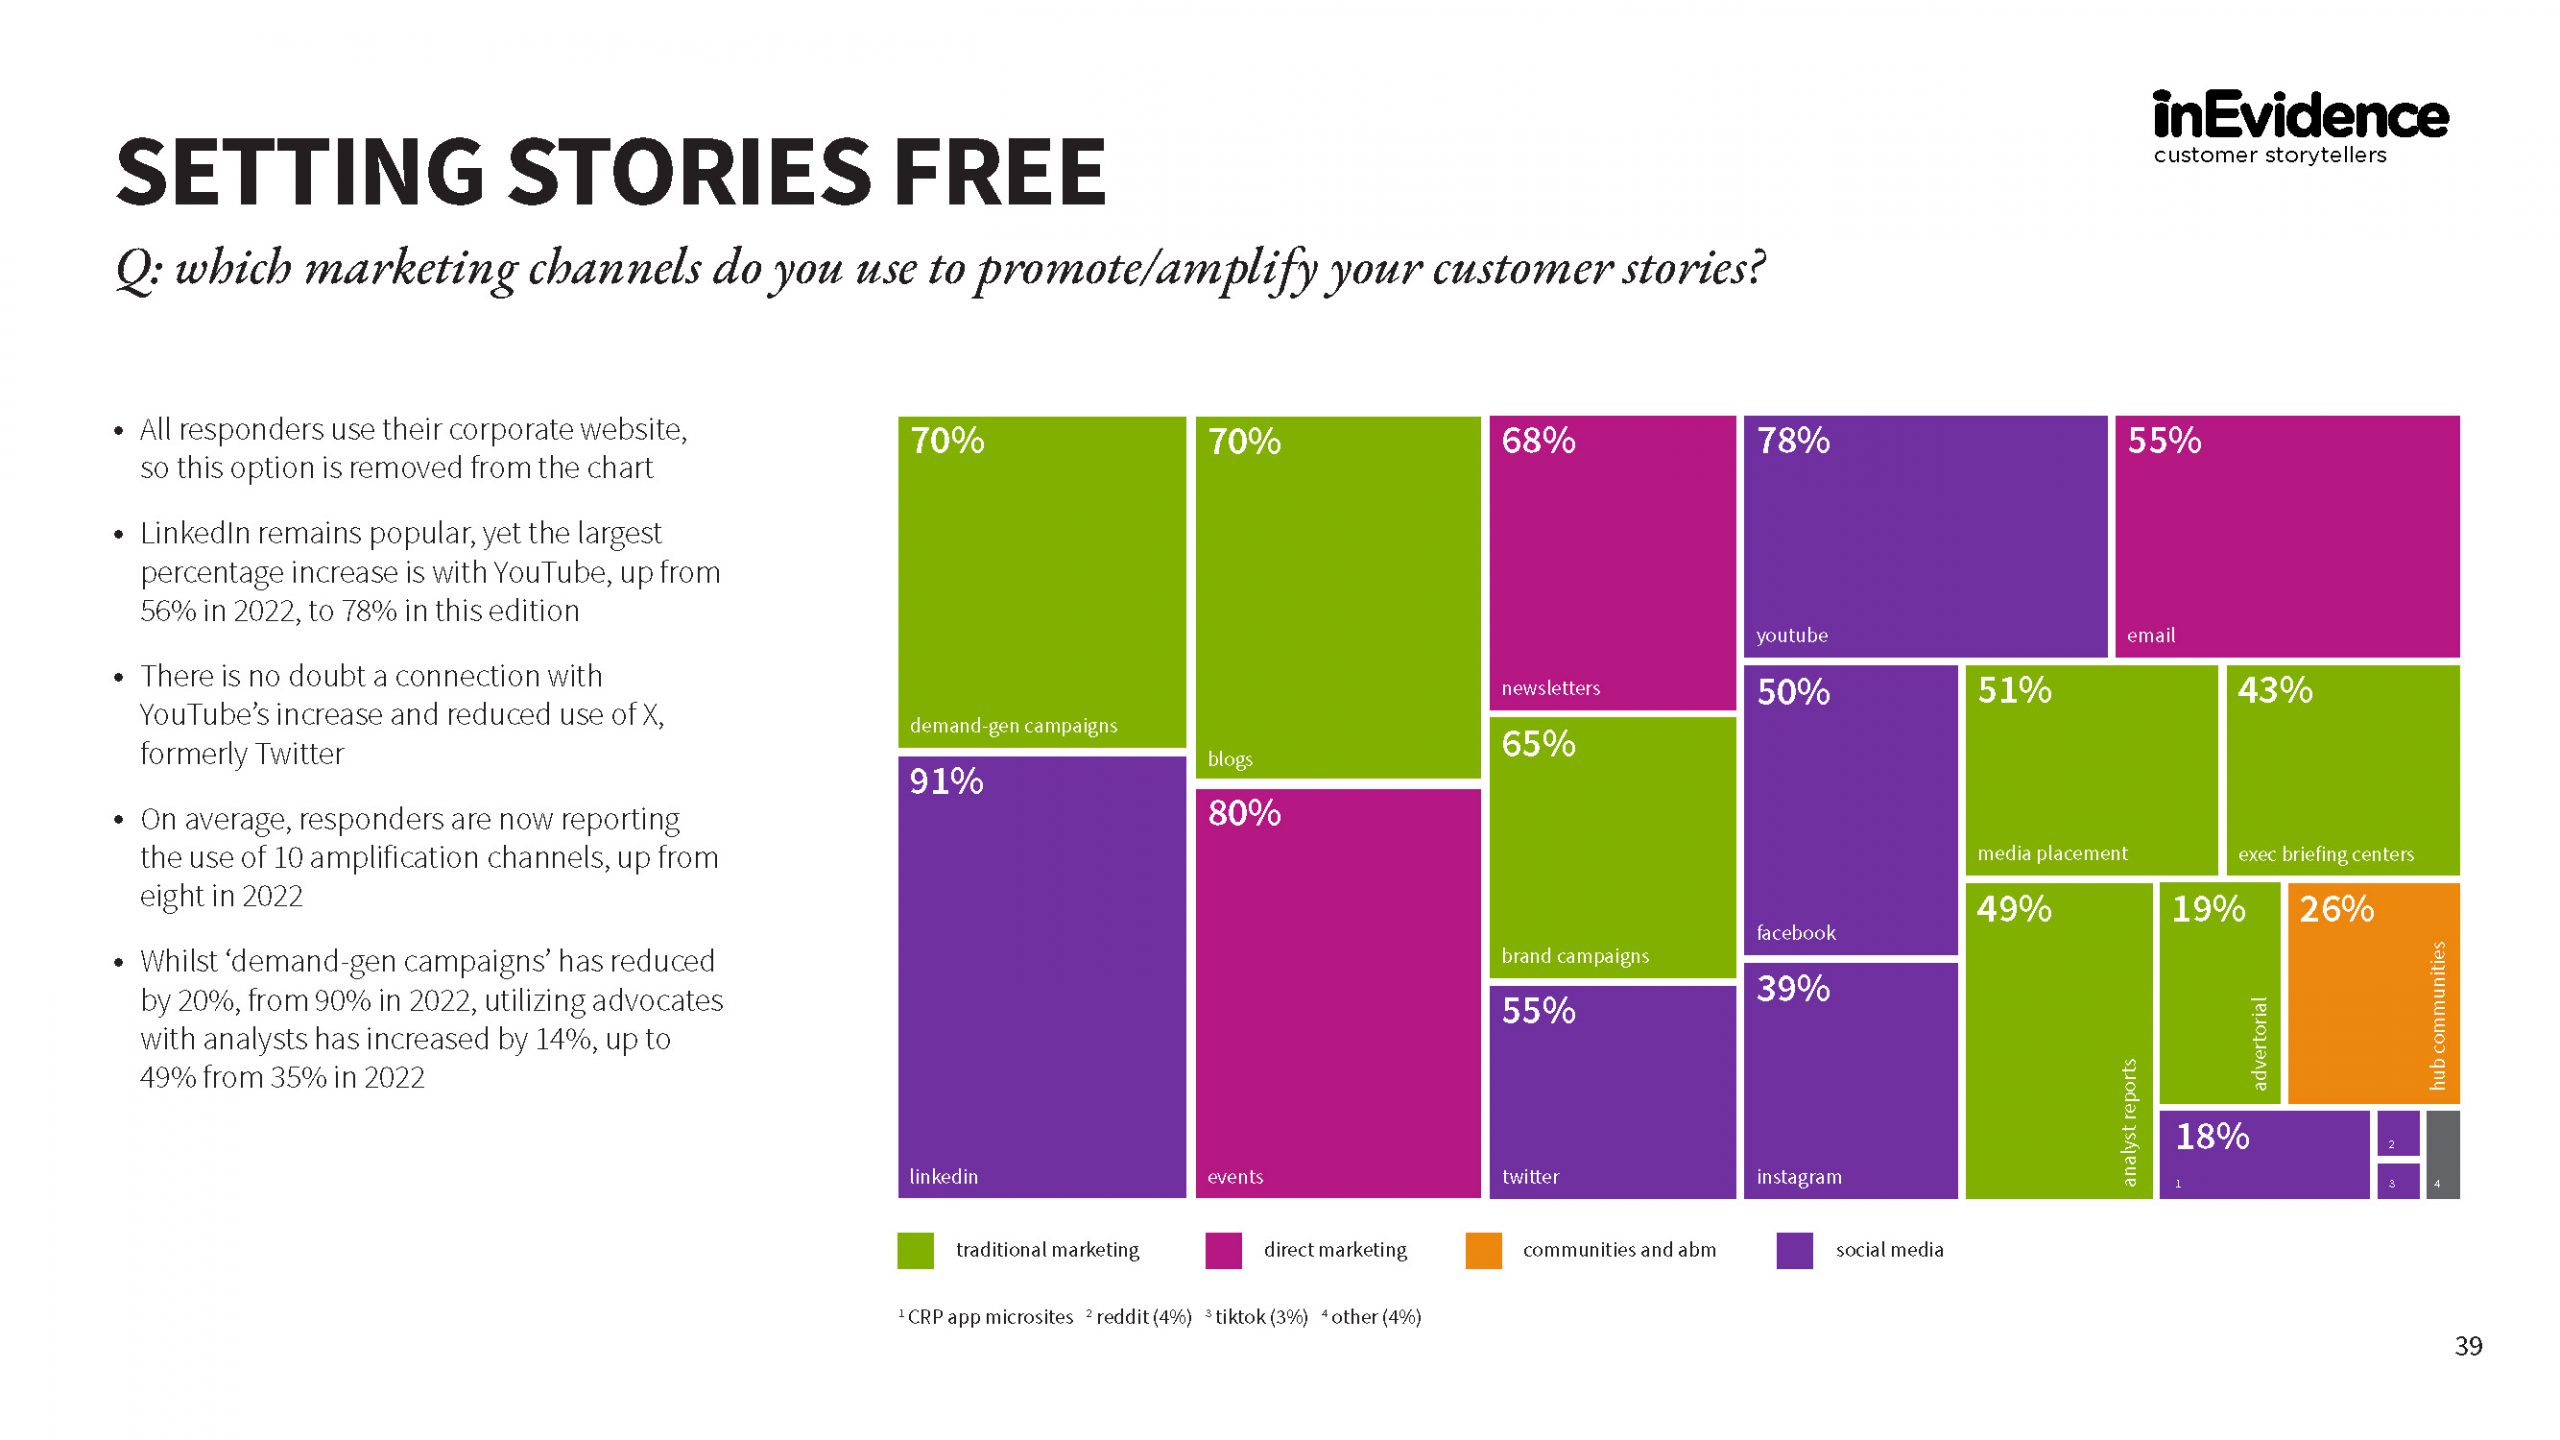
• Use ten comms channels to promote stories
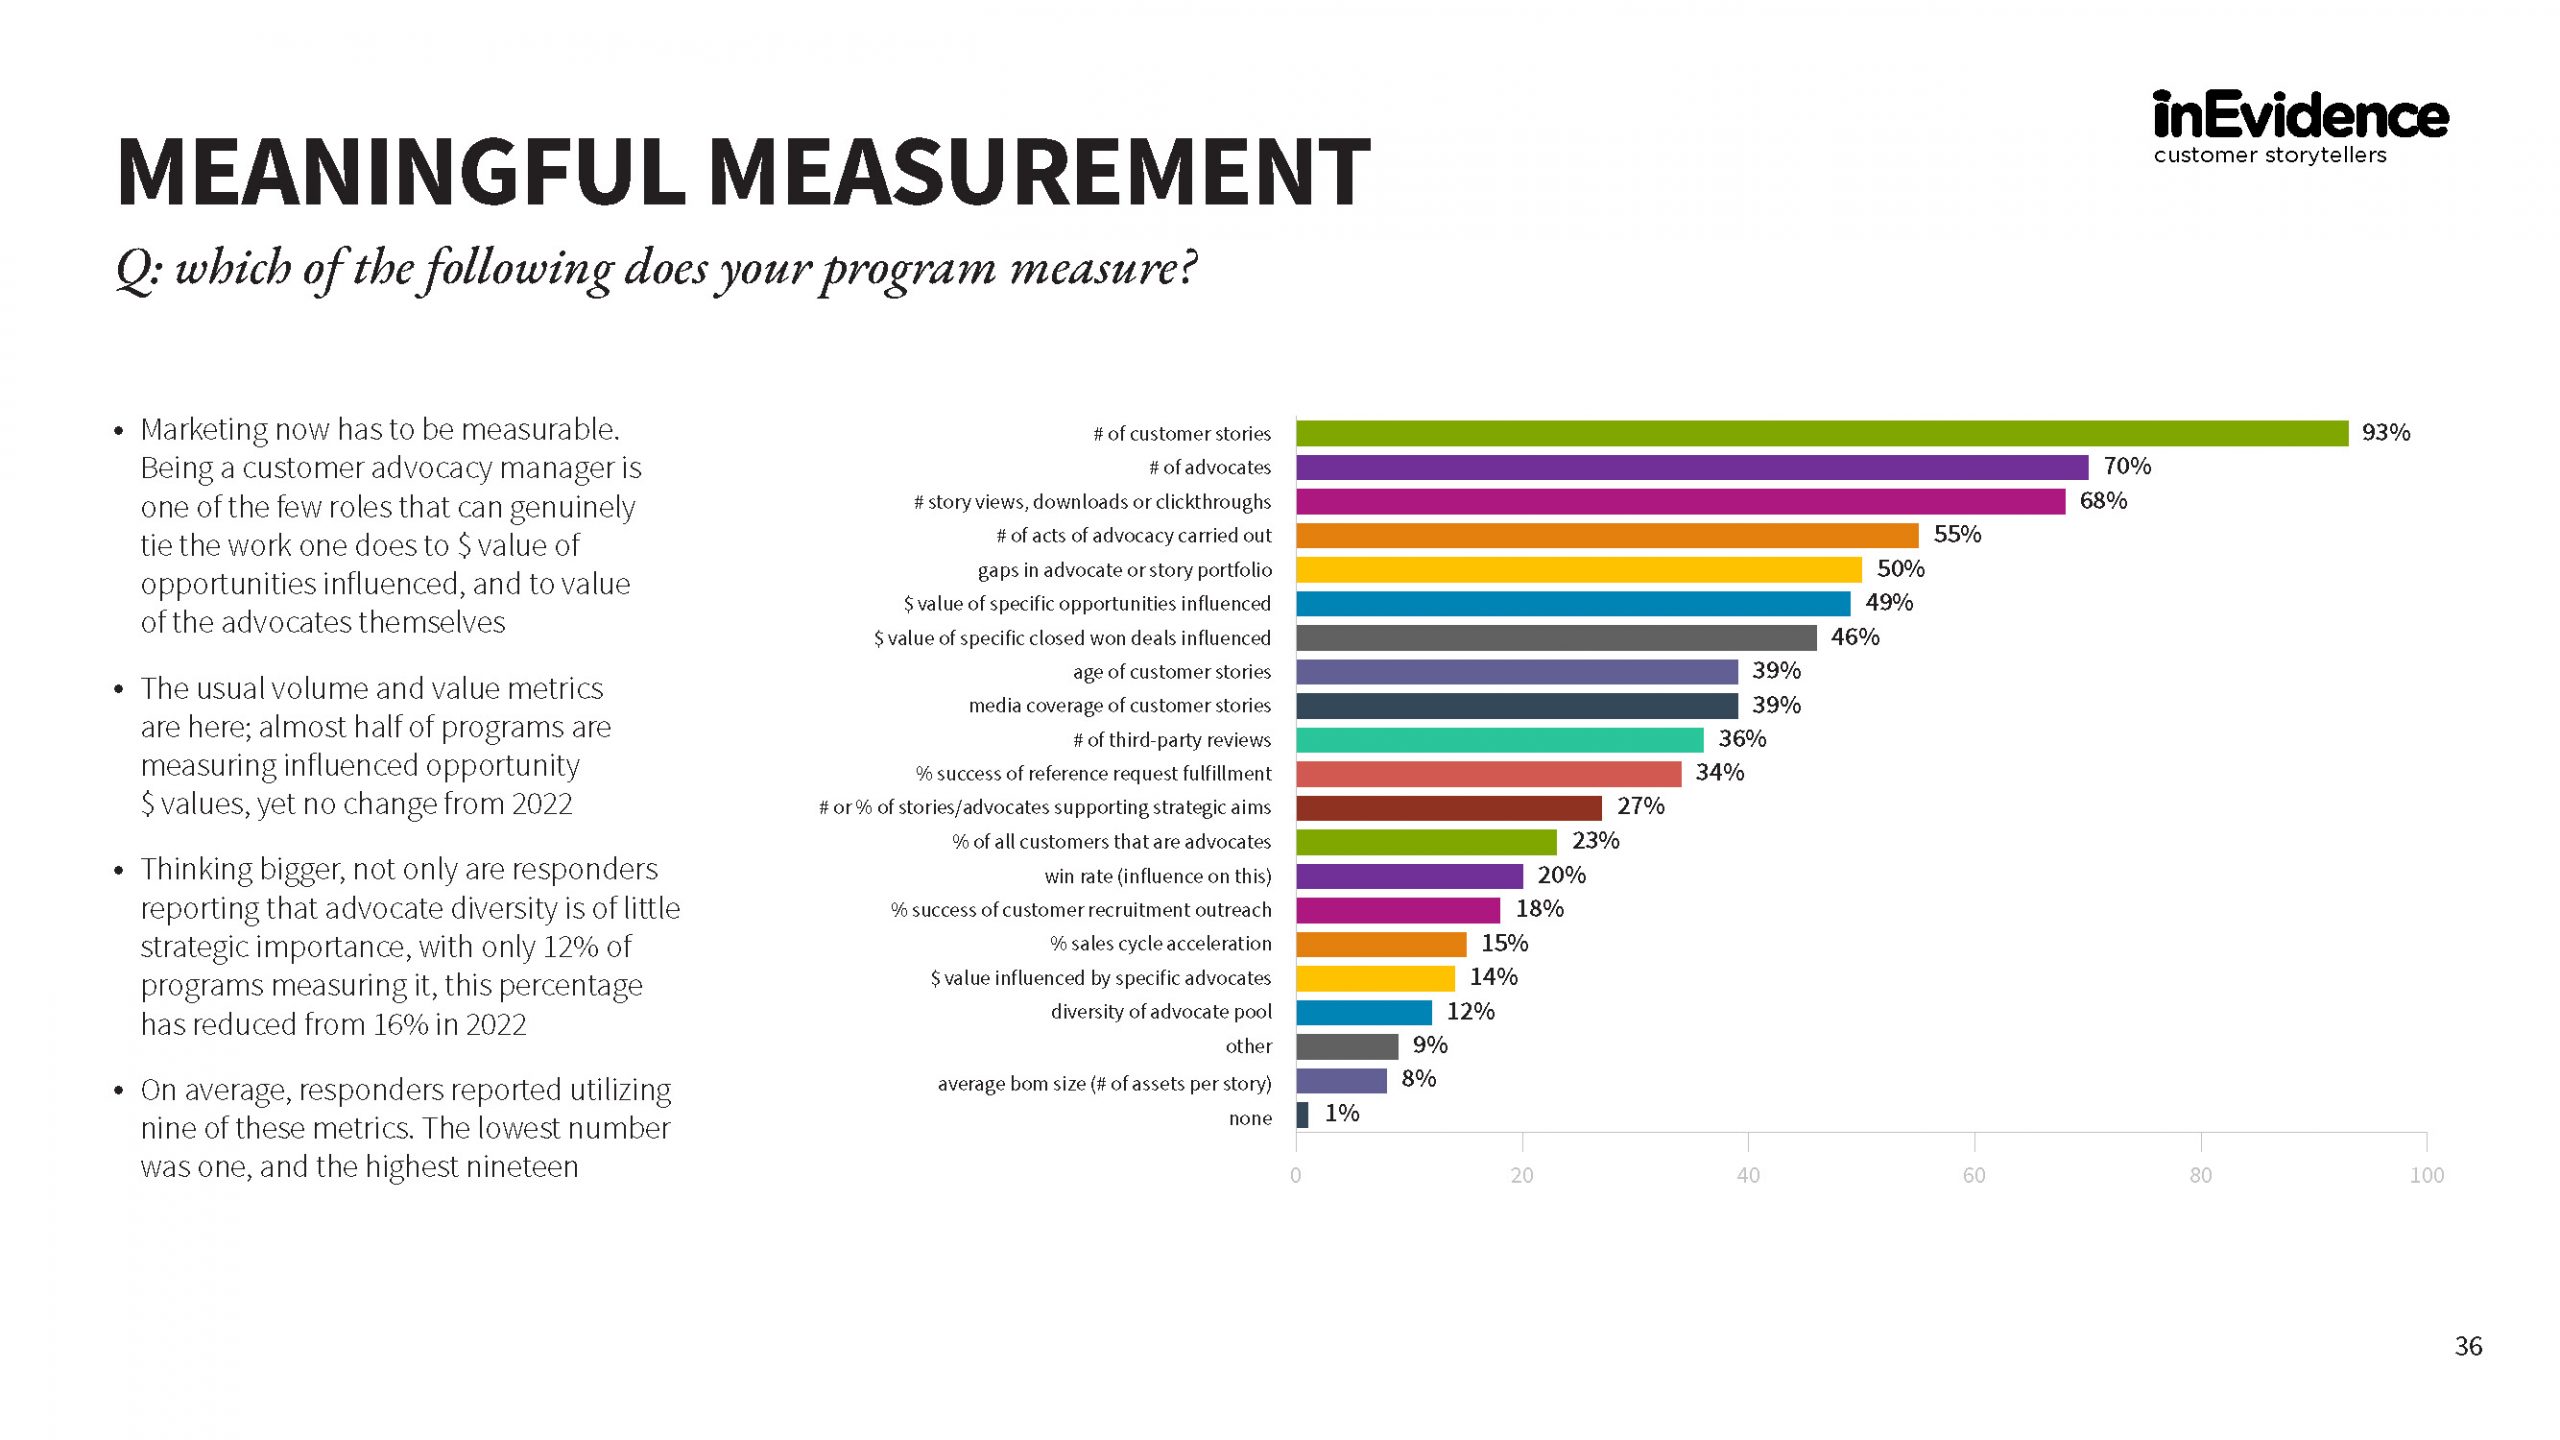
• Report on nine metrics, inc. business impact
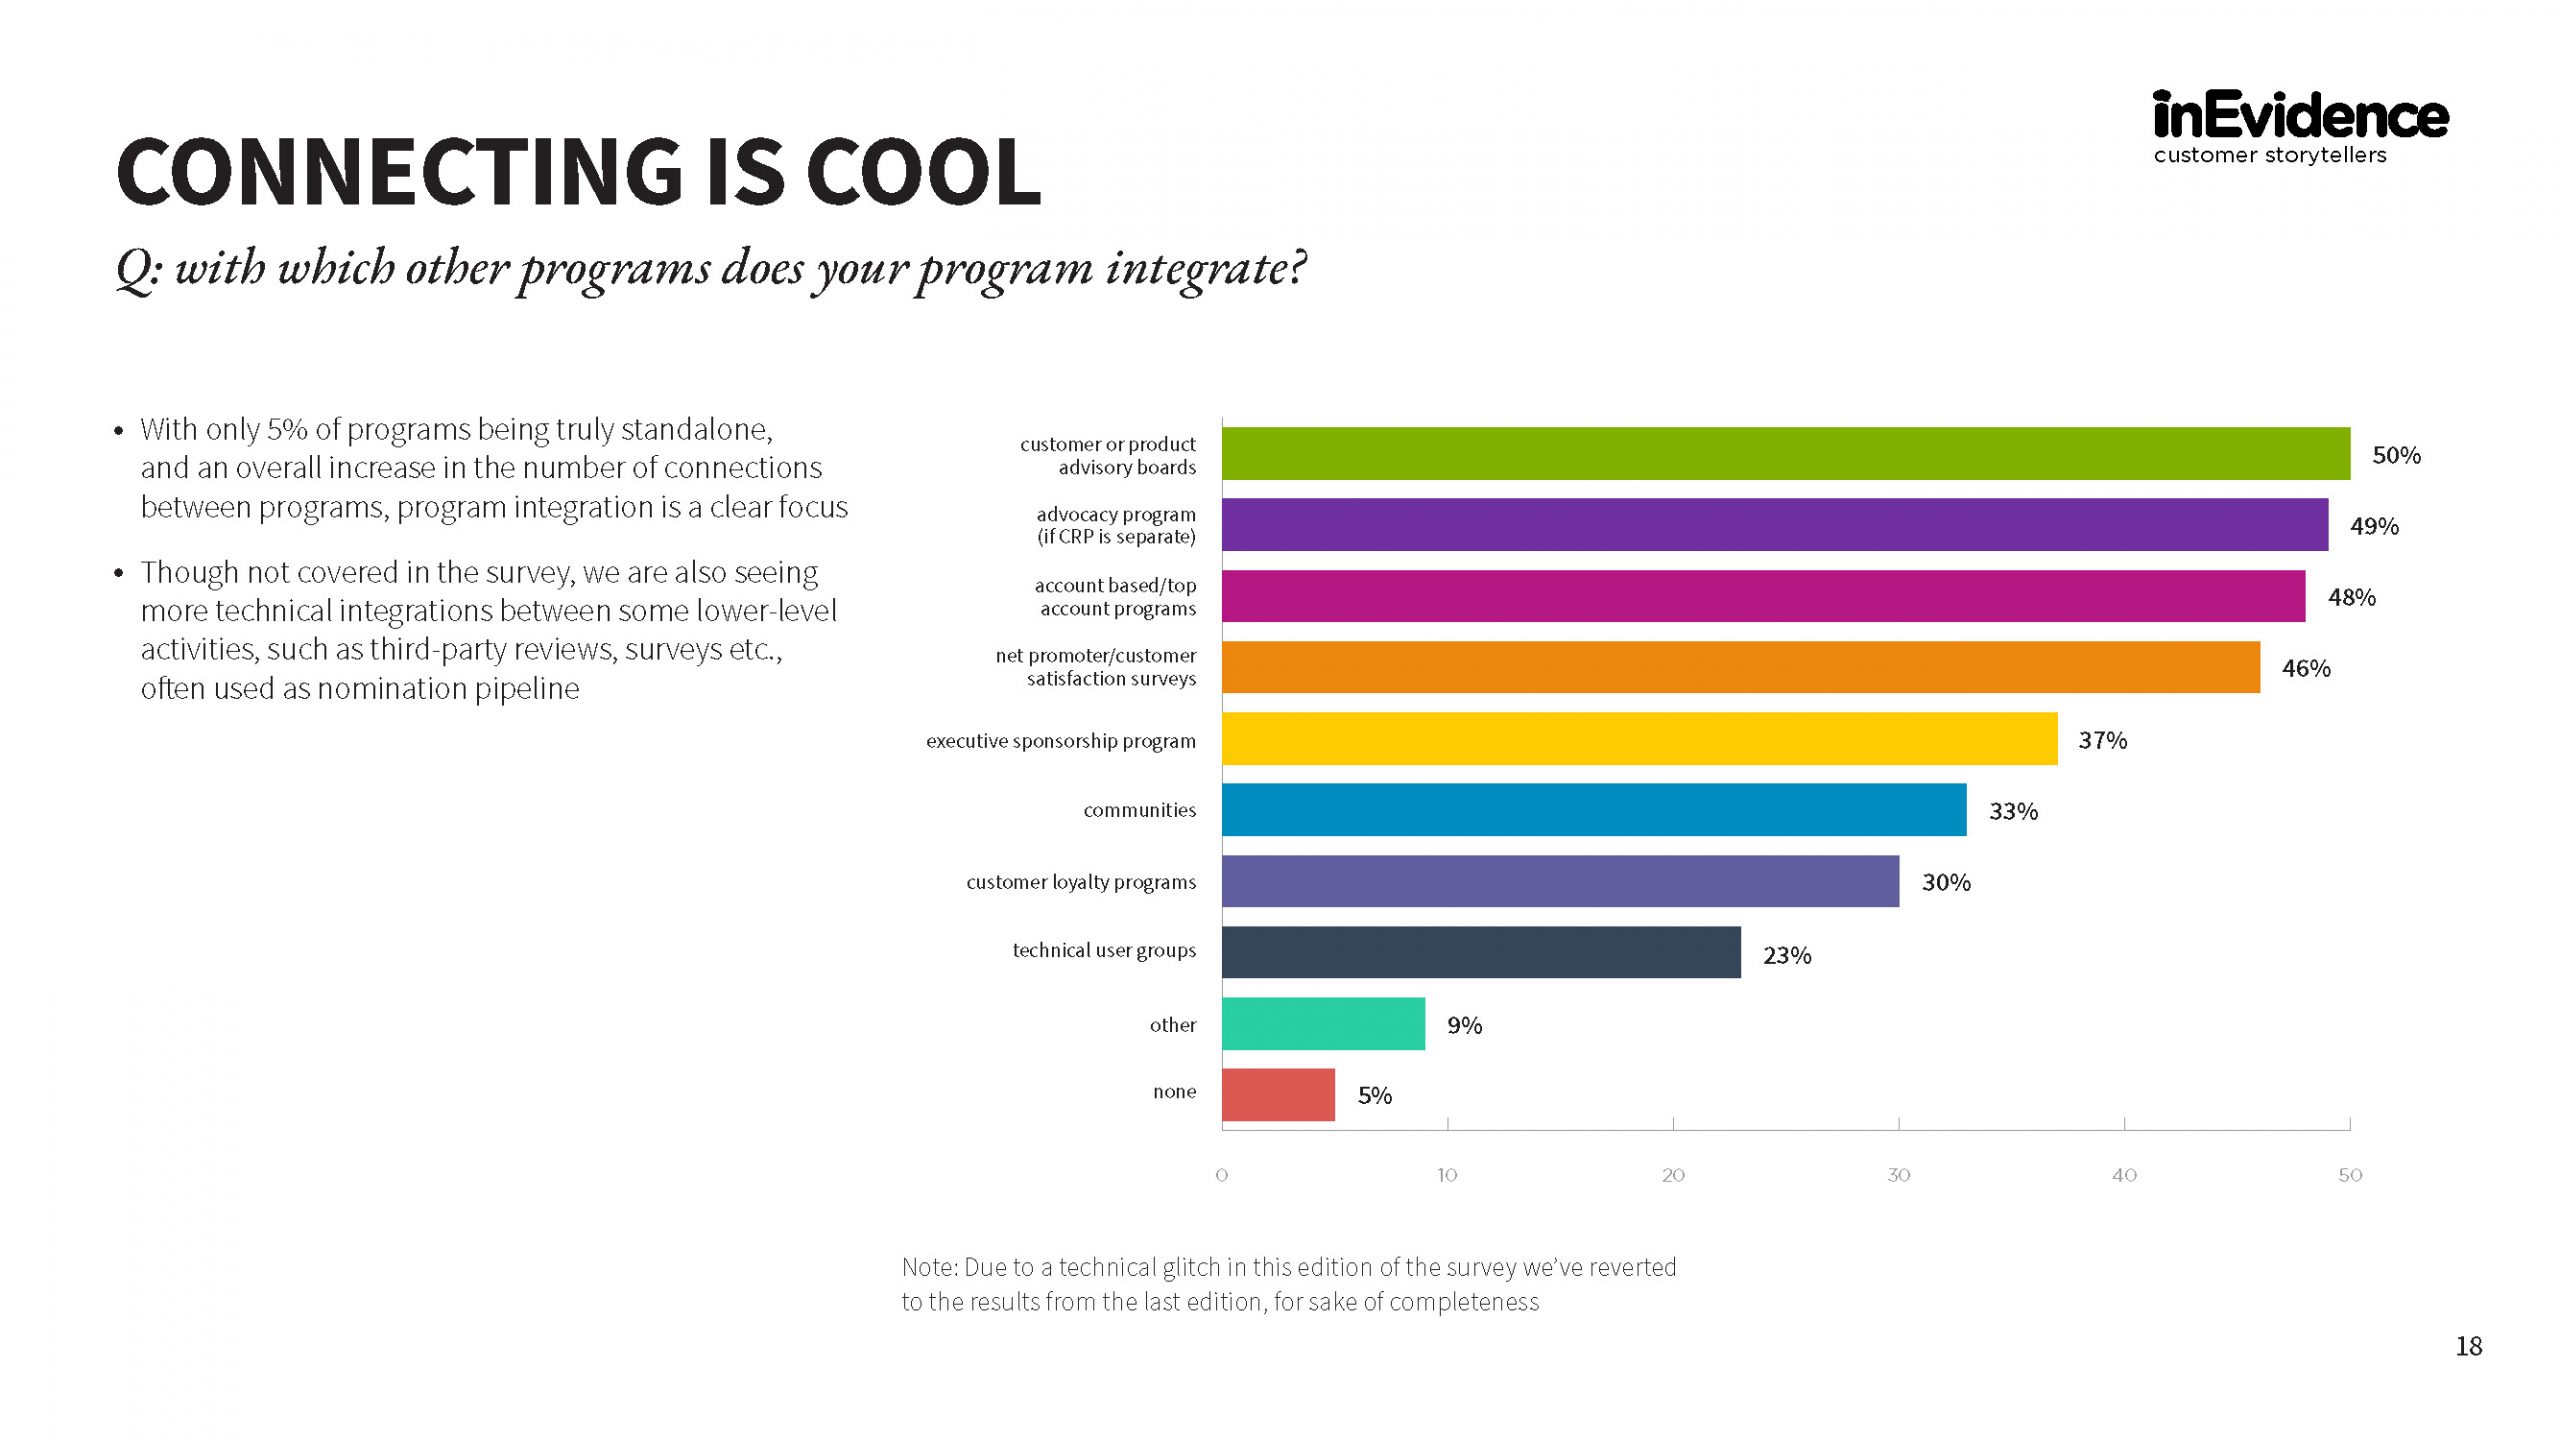
As well as at an organizational level, much of this alignment involves technical integrations, with capacity to create both opportunity and intricacy.
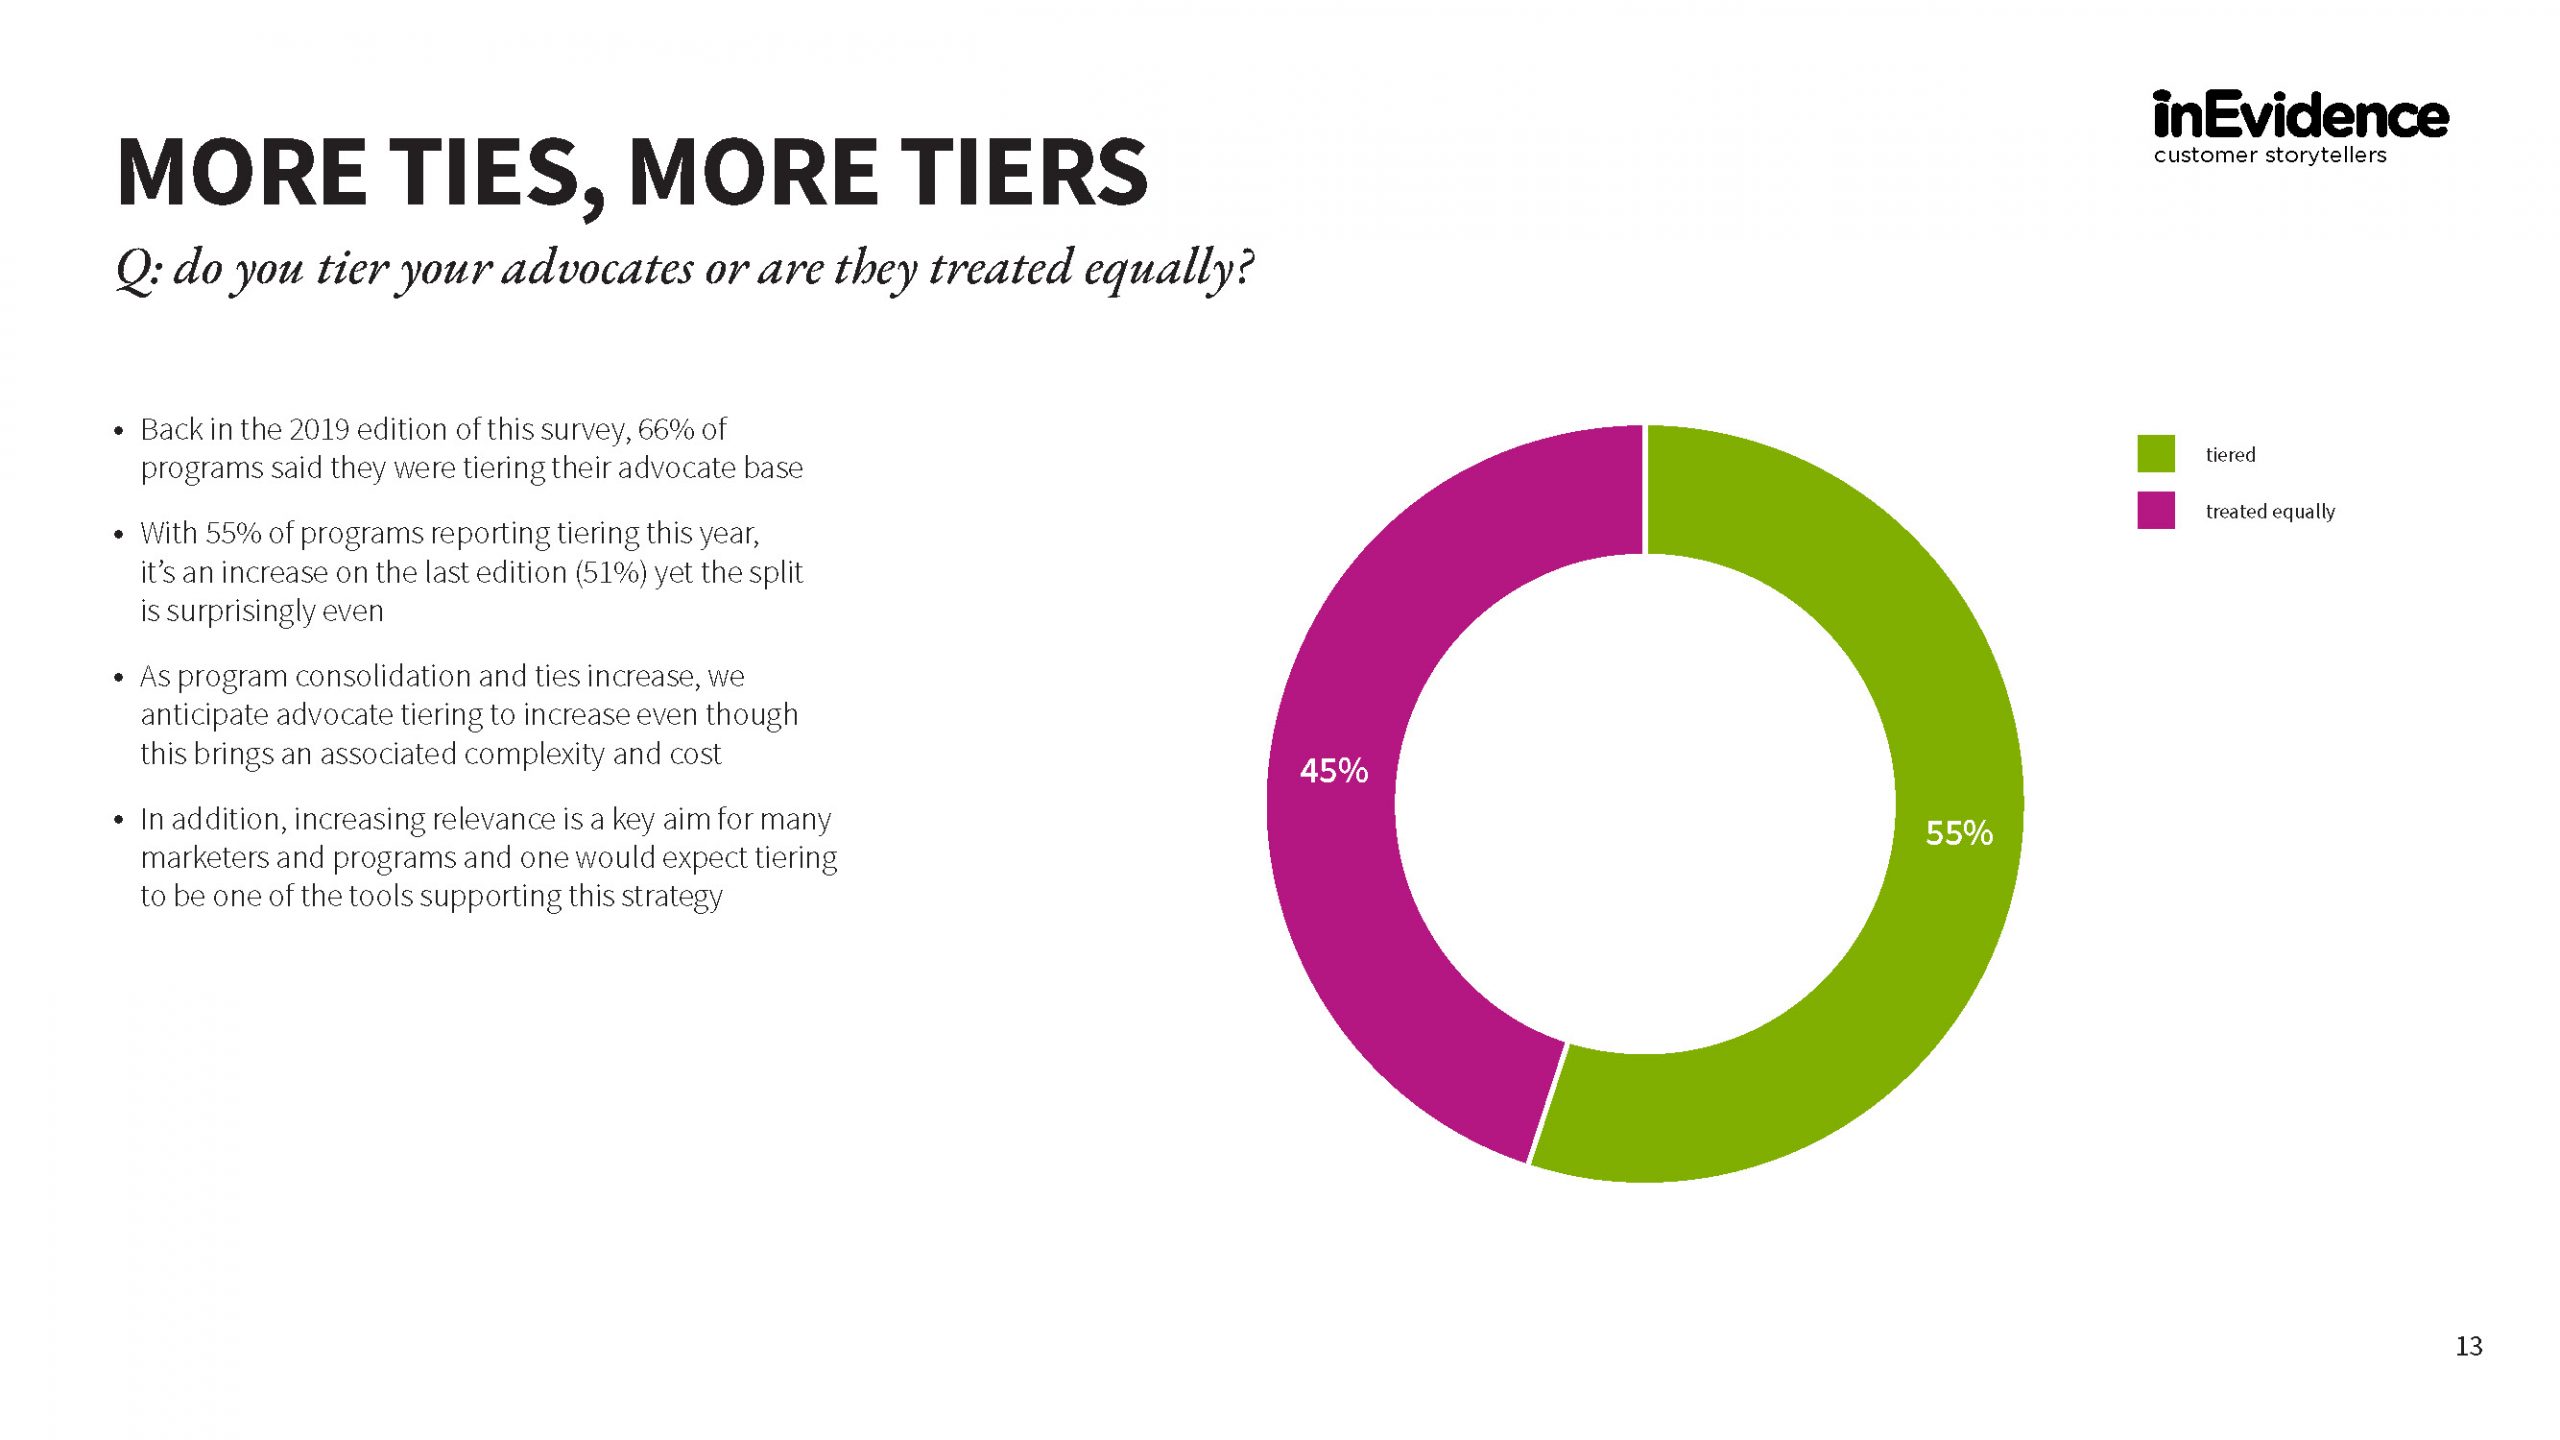
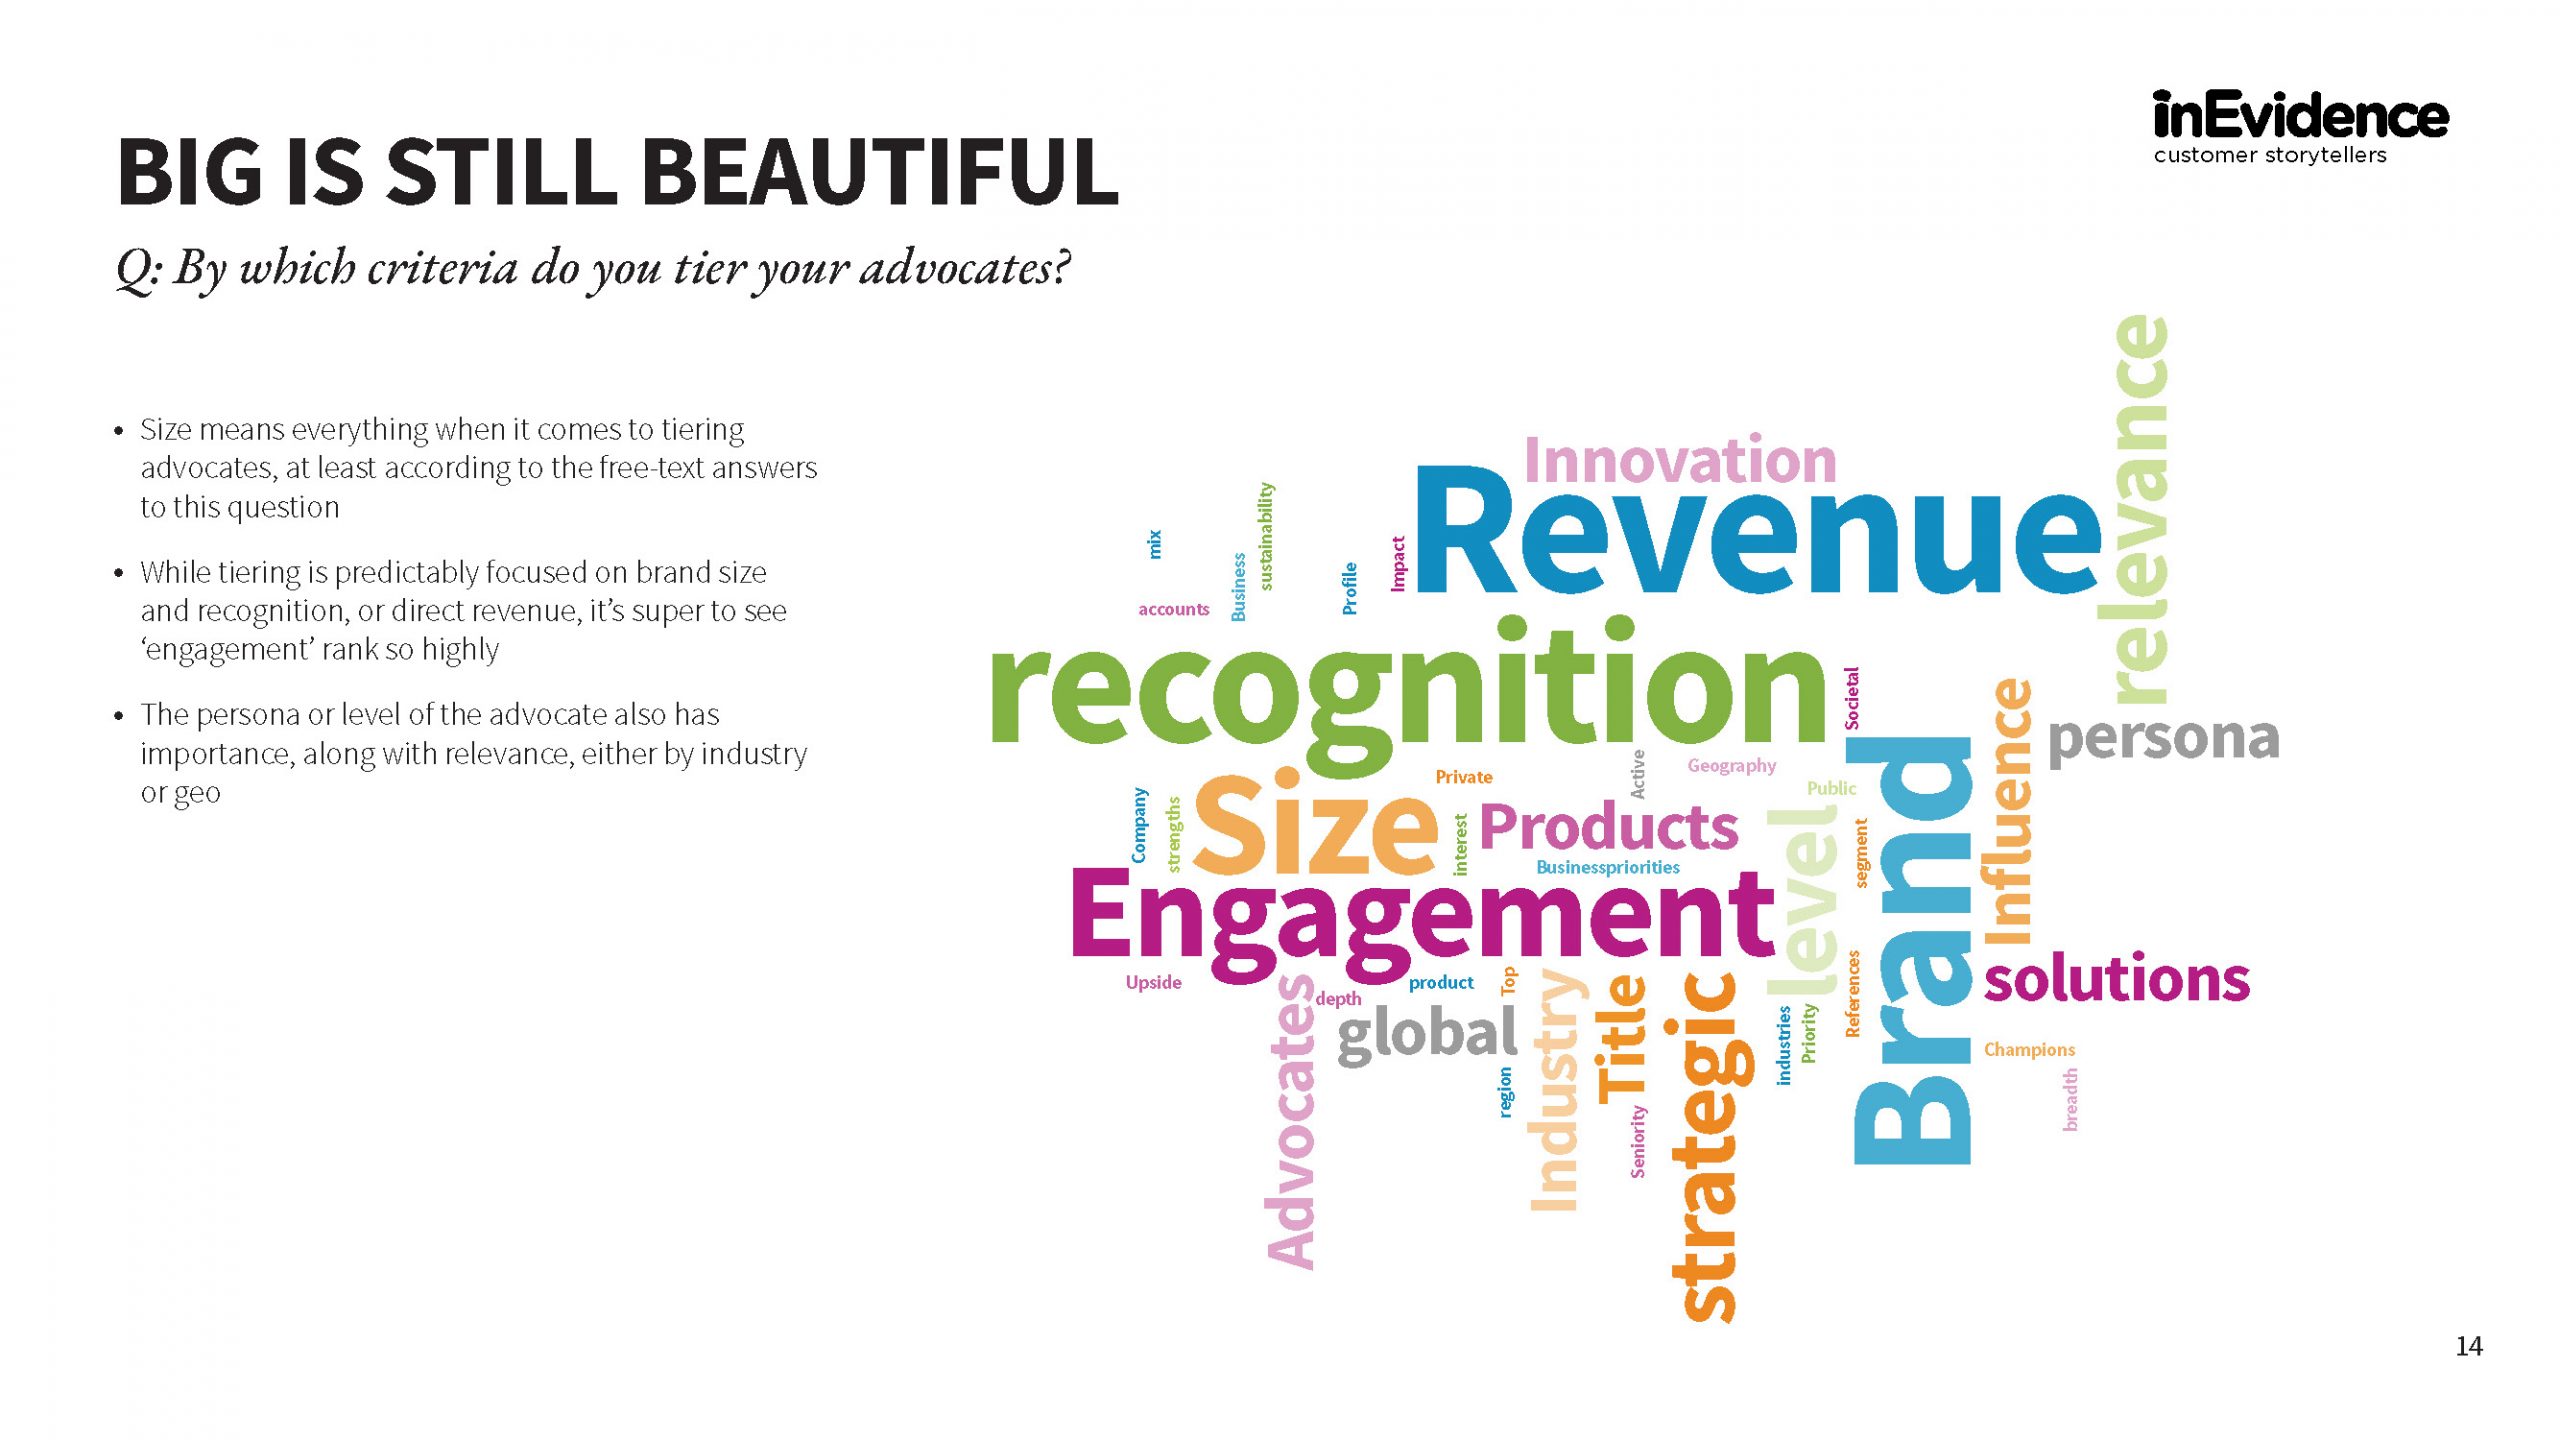
It’s therefore not surprising to see an increase in the tiering of advocates. Alignment is set to continue as a focus throughout 2024.
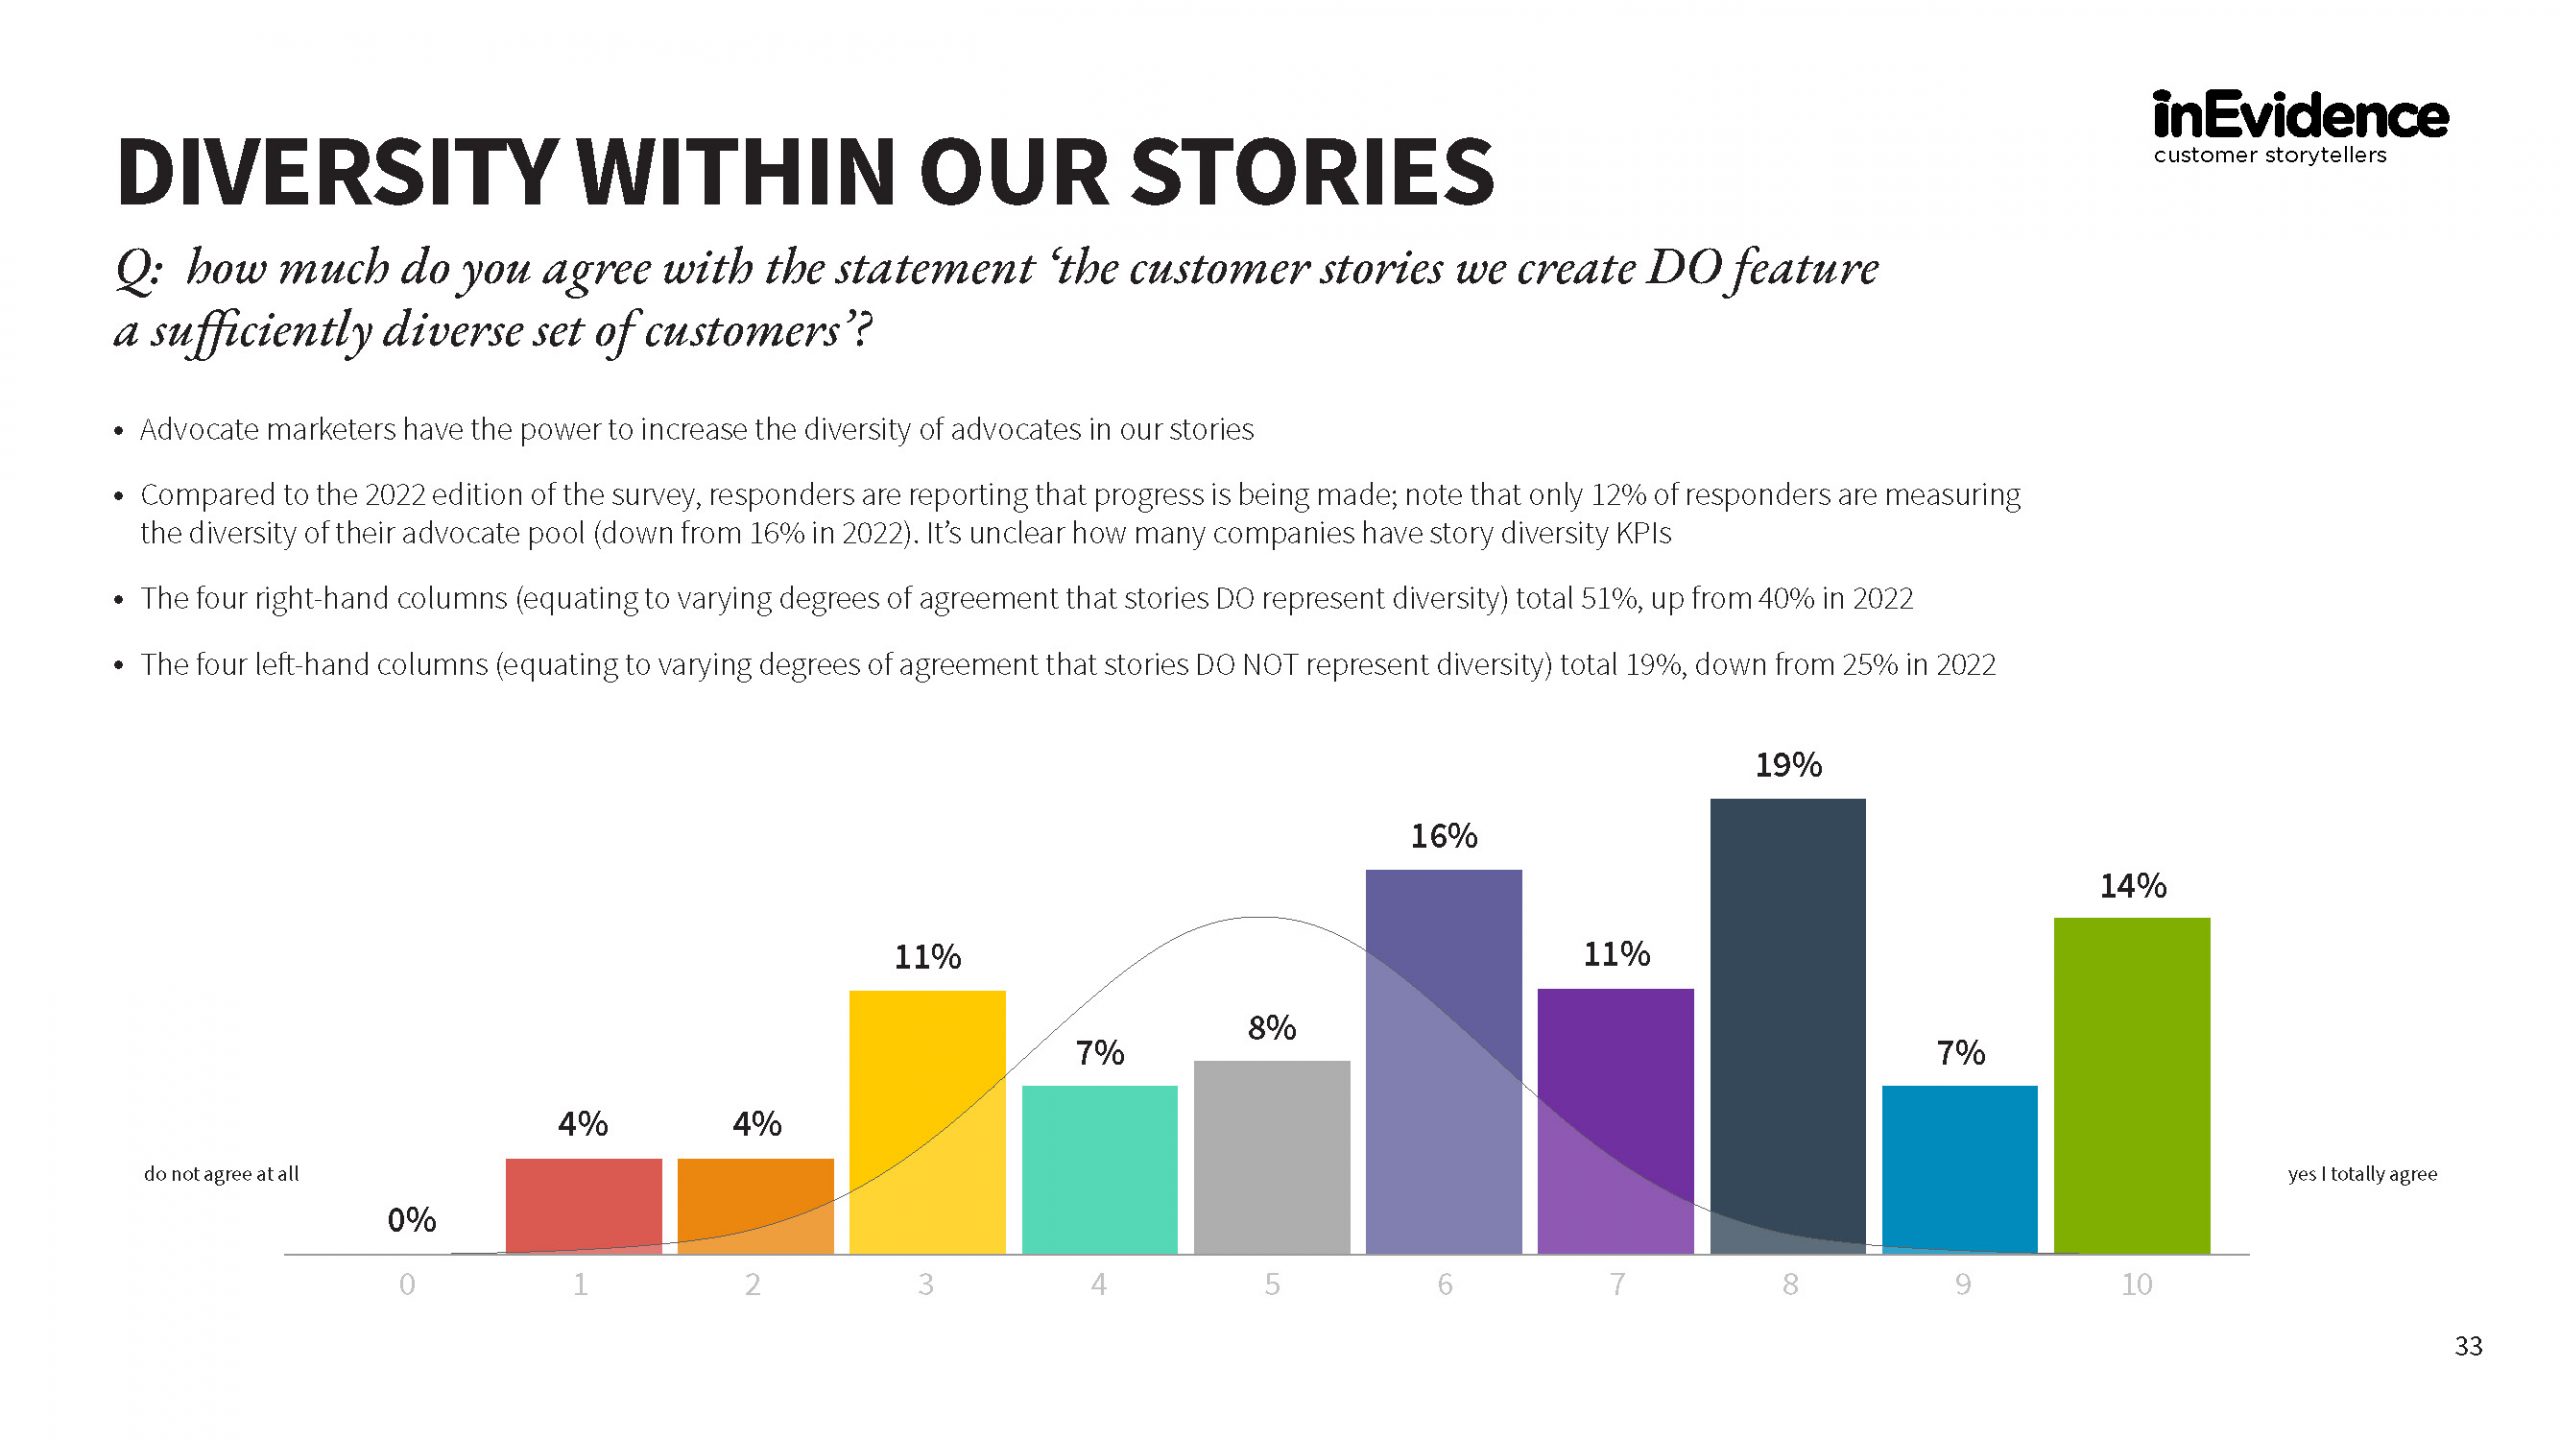
3. Diversity: progress or delusion?
On the face of it, this edition of the survey shows clear positive movement in respect to diversity in customer advocacy.
Zero responders strongly agree there is a lack of diversity within customer stories, with varying degrees of agreement that stories DO represent diversity, totaling 51% up from 40% in 2022.
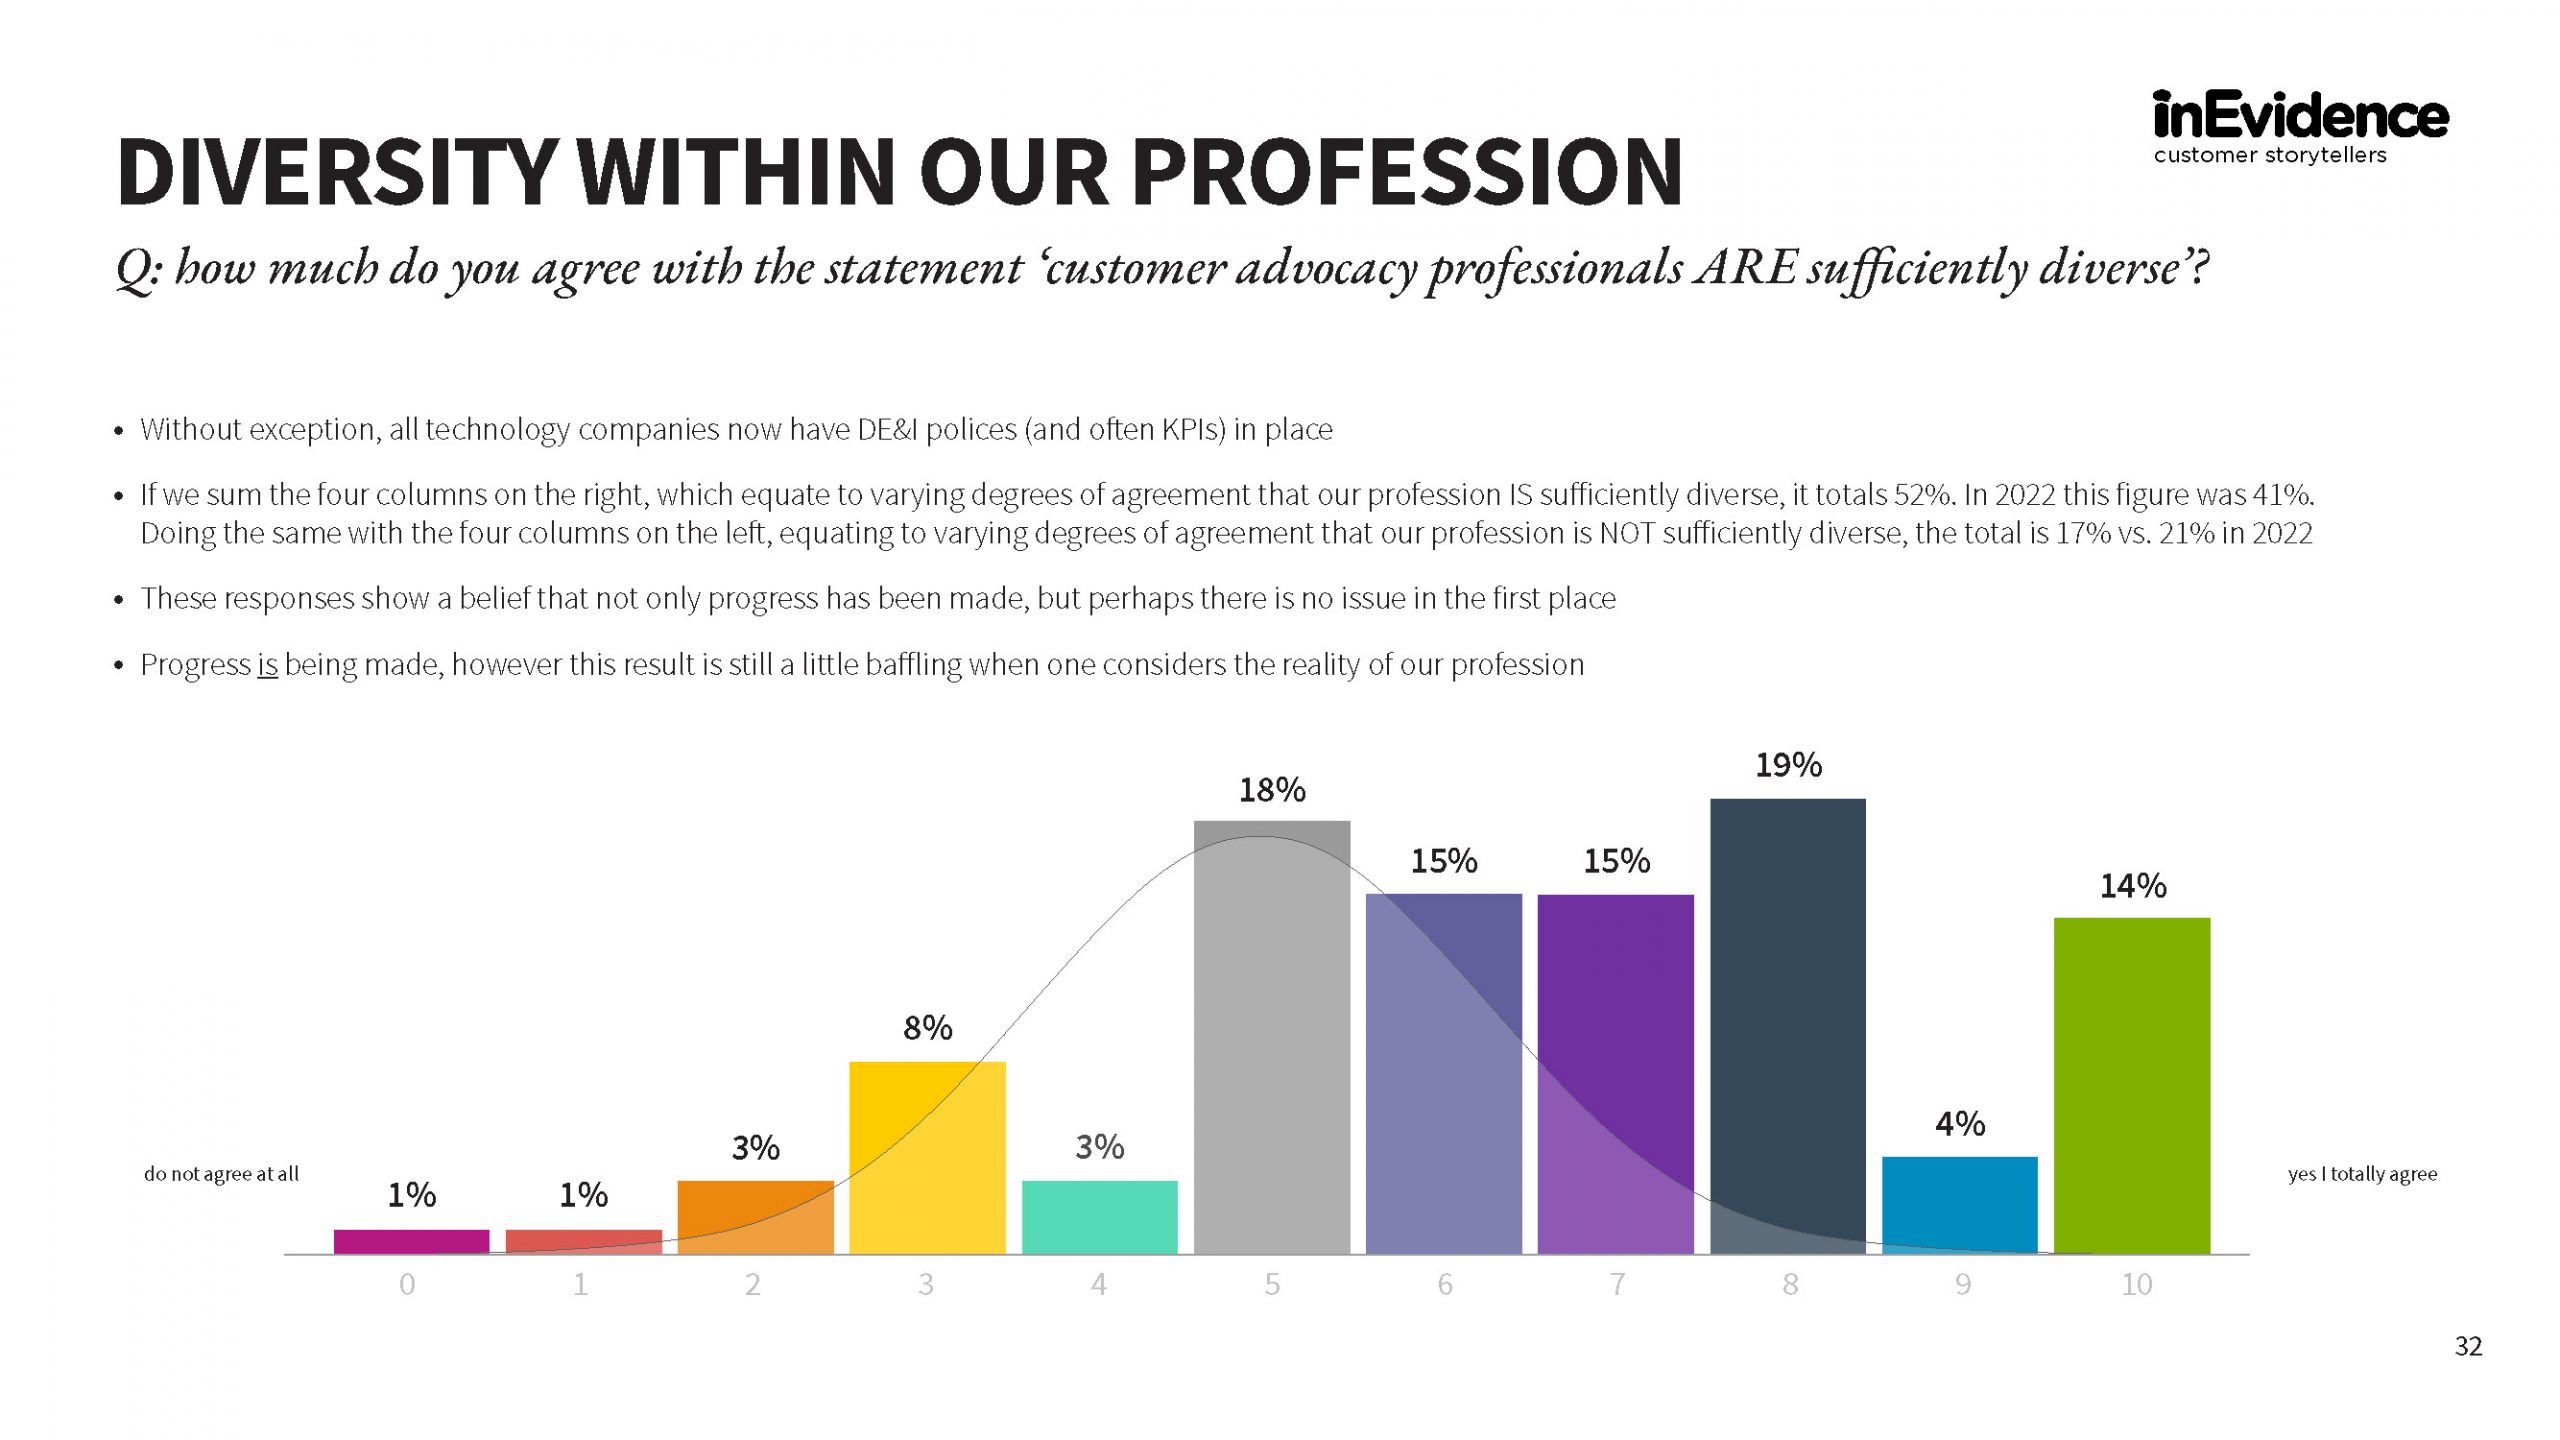
It’s an almost identical opinion for varying degrees of agreement that customer advocacy is diverse, totaling 52% up from 41% in 2022.
Yet only 12% of programs measure advocate pool diversity (down from 16% in 2022), and result sentiment may not match lived experience.
Let’s ensure progress is real in 2024, and not merely an increase in percentage of denial of a matter to
be addressed. We have the power.